


Quarterly national accounts in Q2 2018 National accounts in base 2014 - Detailed figures
Households' purchasing power went up in Q2 (+0.7% after -0.5%) Quarterly national accounts - detailed figures - second quarter 2018
In Q2 2018, GDP in volume terms* grew at the same rate as in Q1: +0.2%. Household consumption expenditures faltered slightly (−0.1% after +0.2%), whereas total gross fixed capital recovered sharply (GFCF: +0.8% after +0.1%). Overall, final domestic demand excluding inventory contributed as much to GDP growth as in Q1 (+ 0.2 points).
Imports bounced back during this quarter (+0.7% after −0.6%), as did exports to a lesser extent (+0.1% after −0.4%). All in all, foreign trade balance contributed negatively to GDP growth: −0.2 points after +0.1 points. Conversely, changes in inventory drove GDP on (+0.2 points after −0.1 points).
graphiqueGraph – GDP and its main components
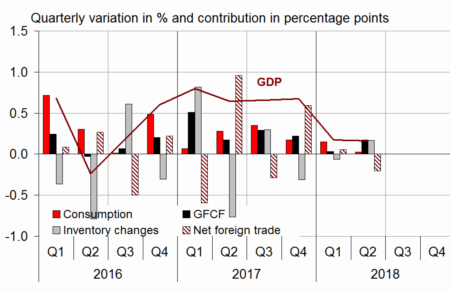
- Source: INSEE

* This growth rate is seasonally and working-day adjusted; volumes are chain-linked previous-year-prices volumes.
tableauTab1 – GDP and its main components: chain-linked volumes
| 2017 Q3 | 2017 Q4 | 2018 Q1 | 2018 Q2 | 2017 | 2018 (ovhg) | |
|---|---|---|---|---|---|---|
| GDP | 0.7 | 0.7 | 0.2 | 0.2 | 2.3 | 1.3 |
| Imports | 1.9 | 0.3 | -0.6 | 0.7 | 4.1 | 1.0 |
| Household consumption *expenditure | 0.4 | 0.2 | 0.2 | -0.1 | 1.1 | 0.6 |
| General government's *consumption expenditure | 0.6 | 0.2 | 0.1 | 0.2 | 1.4 | 0.8 |
| GFCF | 1.3 | 1.0 | 0.1 | 0.8 | 4.7 | 2.3 |
| *of which Non-financial corporated and unincorporated enterprises | 1.6 | 1.3 | 0.1 | 1.2 | 4.4 | 2.9 |
| Households | 1.1 | 0.7 | 0.3 | -0.1 | 5.6 | 1.6 |
| General government | 0.3 | 0.3 | 0.1 | 0.5 | 1.6 | 1.0 |
| Exports | 1.0 | 2.2 | -0.4 | 0.1 | 4.7 | 2.5 |
| Contributions: | ||||||
| Internal demand excluding inventory changes | 0.6 | 0.4 | 0.2 | 0.2 | 2.0 | 1.1 |
| Inventory changes | 0.3 | -0.3 | -0.1 | 0.2 | 0.2 | -0.2 |
| Net foreign trade | -0.3 | 0.6 | 0.1 | -0.2 | 0.1 | 0.4 |
- Source: INSEE
tableauTab2 – Production, consumption and GFCF: main components
| 2017 Q3 | 2017 Q4 | 2018 Q1 | 2018 Q2 | 2017 | 2018 (ovhg) | |
|---|---|---|---|---|---|---|
| Production of branches | 0.8 | 0.9 | 0.1 | 0.3 | 2.6 | 1.6 |
| Goods | 0.8 | 1.1 | -0.6 | -0.2 | 2.2 | 0.7 |
| Manufactured Industry | 0.7 | 1.4 | -1.0 | -0.1 | 2.4 | 0.6 |
| Construction | 0.5 | 0.5 | -0.4 | 0.5 | 3.5 | 0.9 |
| Market services | 0.9 | 1.1 | 0.5 | 0.4 | 3.2 | 2.3 |
| Non-market services | 0.5 | 0.3 | 0.2 | 0.3 | 1.1 | 0.9 |
| Household consumption | 0.4 | 0.2 | 0.2 | -0.1 | 1.1 | 0.6 |
| Food products | -0.5 | 0.2 | -0.3 | -1.3 | 0.3 | -1.2 |
| Energy | 1.3 | -0.7 | 0.8 | -1.8 | 0.1 | -0.1 |
| Engineered goods | 1.1 | -0.1 | -0.2 | 1.2 | 2.6 | 1.3 |
| Services | 0.5 | 0.4 | 0.5 | 0.1 | 1.6 | 1.2 |
| GFCF | 1.3 | 1.0 | 0.1 | 0.8 | 4.7 | 2.3 |
| Manufactured goods | 1.7 | 1.8 | -1.0 | 1.5 | 3.7 | 2.4 |
| Construction | 0.7 | 0.3 | 0.0 | 0.4 | 3.5 | 1.3 |
| Market services | 1.8 | 1.3 | 1.0 | 0.6 | 7.0 | 3.6 |
- Source: INSEE
Purchasing power bounced back in Q2 2018
Households' gross disposable income (HDI) grew in current euros in Q2 2018 (+1.1% after +0.1%). The gross payroll growth slowed down slightly (+0.7% after +0.9%), but was balanced by a decrease in the taxes on income and wealth. This decrease has been due to the substitution of the wealth tax (ISF), by the property tax (IFI). Households' social benefits growth has remained constant (+0.5% during both quarters).
Households' consumption prices slowed down slightly in Q2 (+0.4% after +0.6%), mainly because the energy prices increased slowly, so that the purchasing power bounced back clearly in Q2 (+0.7% after −0.5%). When measured per consumption unit, it has also recovered (+0.6% after −0.6 %). Households' consumption decreased a bit (−0.1% after +0.2%), while purchasing power grew. As a result, the saving rate went up: it stood at 14.3% after 13.7% in Q2 2018.
tableauTab3 – Sectoral accounts
| 2017 Q3 | 2017 Q4 | 2018 Q1 | 2018 Q2 | 2017 | 2018 (ovhg) | |
|---|---|---|---|---|---|---|
| Profit ratio of NFCs* (level) | 32.1 | 32.0 | 32.0 | 31.5 | 32.0 | |
| Households' purchasing power | 0.5 | 0.2 | -0.5 | 0.7 | 1.4 | 0.6 |
- *NFCs: non-financial corporations
- Source: INSEE
tableauTab4 – Households' disposable income and ratios of households' account
| 2017 Q3 | 2017 Q4 | 2018 Q1 | 2018 Q2 | 2017 | 2018 (ovhg) | |
|---|---|---|---|---|---|---|
| HDI | 0.6 | 0.7 | 0.1 | 1.1 | 2.7 | 2.0 |
| Household purchasing power | 0.5 | 0.2 | -0.5 | 0.7 | 1.4 | 0.6 |
| HDI by cu* (purchasing power) | 0.4 | 0.1 | -0.6 | 0.6 | 0.9 | 0.2 |
| Adjusted HDI (purchasing power) | 0.5 | 0.2 | -0.3 | 0.6 | 1.5 | 0.7 |
| Saving rate (level) | 14.3 | 14.3 | 13.7 | 14.3 | 14.2 | |
| Financial saving rate (level) | 4.4 | 4.4 | 3.7 | 4.2 | 4.4 |
- *cu: consumption unit
- Source: INSEE
Non-financial corporations' profit ratio decreased
In Q2 2018, non-financial corporations' profit ratio decreased at 31.5% (after 32.0%). It is due to the decline of productivity gains, the slight rebound of real wages and the further deterioration of the terms of trade.
tableauTab5 – Ratios of non-financial corporations' account
| 2017 Q3 | 2017 Q4 | 2018 Q1 | 2018 Q2 | 2017 | |
|---|---|---|---|---|---|
| Profit share | 32.1 | 32.0 | 32.0 | 31.5 | 32.0 |
| Investment ratio | 23.5 | 23.6 | 23.6 | 23.9 | 23.5 |
| Savings ratio | 23.0 | 22.3 | 22.8 | 22.4 | 22.5 |
| Self-financing ratio | 97.7 | 94.4 | 96.5 | 93.8 | 95.9 |
- Source: INSEE
General government deficit increased slightly in Q2 2018
In Q2 2018, general government net borrowing increased a little (+0.1 points): the public deficit stands at 2.5% of the GDP after 2.4% in Q1 2018.
General government expenditure declined slightly in Q2 (−0.2% after +0.6%). Indeed, the amounts paid to businesses to refund the 3% tax on dividends still decreased. Moreover, both the French contribution to the European budget and subsidies slowed down after a dynamic Q1, mainly due for the latter to the increase in CICE regarding wages paid in 2017.
Government receipts declined (−0.3% after +0.1%), mostly because of the decrease in the taxes on income and wealth. This decrease is due to a cut of the corporate income tax rate for income up to 500,000€ and the substitution of the wealth tax (ISF) by the property tax (IFI).
tableauTab6 – Expenditure, receipts and net borrowing of public administrations
| 2017 Q3 | 2017 Q4 | 2018 Q1 | 2018 Q2 | 2017 | |
|---|---|---|---|---|---|
| In billions of euros | |||||
| Total expenditure | 326.8 | 327.1 | 329.1 | 328.3 | 1294.3 |
| Total receipts | 309.0 | 314.6 | 314.8 | 313.8 | 1232.7 |
| Net lending (+) or borrowing (–) | -17.8 | -12.4 | -14.3 | -14.5 | -61.6 |
| In % of GDP | |||||
| Net lending (+) or borrowing (–) | -3.1 | -2.1 | -2.4 | -2.5 | -2.7 |
- Source: INSEE
Revisions
GDP growth estimate for Q1 2018 is confirmed at +0.2%. Slight revisions in different aggregates offset each other; they are mainly due to the revision of indicators and to the update of seasonal adjustment coefficients. The purchasing power growth for Q1 is revised by +0.1 points, mainly due to an increase in dividends received by households.
Avertissement
Quarterly national accounts
Quarterly debt of the general government
Sources
Quarterly national accounts
Quarterly accounts are a consistent set of indicators which provides a global overview of recent economic activity.
Time series of the main aggregates of quarterly national accounts can be accessed through the "Summary". They are classified into eight categories:
- Gross domestic product (GDP) and main economic aggregates ;
- Goods and services ;
- Households' consumption ;
- Foreign trade ;
- Activities ;
- Institutional sectors ;
- Households' income and purchasing power ;
- Public finances.
For each category, are available :
- synthetic files displaying from the accounts the relevant information for economic analysis ,
- sometimes, one or two files displaying all the data available.
Documentation
Abbreviated methodology (pdf, 140 Ko )
Methodology - First estimate at 30 days (pdf, 112 Ko )