


Quarterly national accounts in Q2 2018 National accounts in base 2014 - Detailed figures
French GDP rose by 0.2% in Q2 2018 Quarterly national accounts - first estimate - second quarter 2018
In Q2 2018, GDP in volume terms* rose at the same pace as in Q1: +0.2%. Household consumption expenditures faltered slightly (−0.1% after +0.2%), whereas total gross fixed capital formation recovered sharply (GFCF: +0.7% after +0.1%). Overall, final domestic demand excluding inventory changes contributed as much to GDP growth as in Q1 (+0.2 points).
Imports bounced back this quarter (+1.7% after −0.3%) as did exports to a lesser extent (+0.6% after −0.4%). All in all, foreign trade balance contributed negatively to GDP growth, −0.3 points, after a neutral contribution in Q1. Conversely, changes in inventories drove GDP on (+0.3 points after 0.0 points).
graphiqueGraph – GDP and its main components
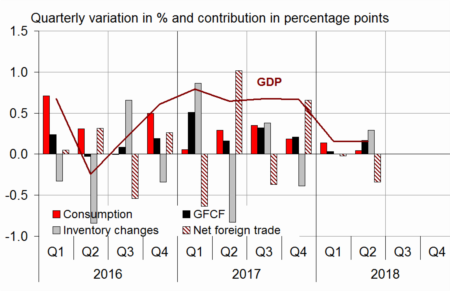
- Source: INSEE

* This growth rate is seasonally and working-day adjusted; volumes are chain-linked previous-year-prices volumes.
tableauTab1 – GDP and its main components: chain-linked volumes
| 2017 Q3 | 2017 Q4 | 2018 Q1 | 2018 Q2 | 2017 | 2018 (ovhg) | |
|---|---|---|---|---|---|---|
| GDP | 0.7 | 0.7 | 0.2 | 0.2 | 2.3 | 1.3 |
| Imports | 2.0 | 0.3 | -0.3 | 1.7 | 4.1 | 2.0 |
| Household consumption *expenditure | 0.4 | 0.2 | 0.2 | -0.1 | 1.1 | 0.5 |
| General government's *consumption expenditure | 0.6 | 0.3 | 0.2 | 0.4 | 1.4 | 1.1 |
| GFCF | 1.4 | 0.9 | 0.1 | 0.7 | 4.7 | 2.3 |
| *of which Non-financial corporated and unincorporated enterprises | 1.8 | 1.2 | 0.1 | 1.1 | 4.4 | 2.8 |
| Households | 1.0 | 0.7 | 0.2 | -0.1 | 5.6 | 1.6 |
| General government | 0.3 | 0.3 | 0.2 | 0.7 | 1.6 | 1.3 |
| Exports | 0.8 | 2.5 | -0.4 | 0.6 | 4.7 | 3.0 |
| Contributions: | ||||||
| Internal demand excluding inventory changes | 0.7 | 0.4 | 0.2 | 0.2 | 2.0 | 1.1 |
| Inventory changes | 0.4 | -0.4 | 0.0 | 0.3 | 0.2 | -0.1 |
| Net foreign trade | -0.4 | 0.7 | 0.0 | -0.3 | 0.1 | 0.3 |
- Source: INSEE
Total production slightly increased
Production in goods and services barely accelerated in Q2 2018 (+0.2% after +0.1%). It fell back again in goods (−0.3% after −0.6%) while it continued to grow in services (+0.4% after +0.3%).
Output in manufactured goods fell back again (−0.2% after −1.0%). Production in refinery stepped back (−9.9% after −1.6%) due to technical maintenance; production in electricity and gas dropped too (−1.7% after +1.9%). However, construction bounced back (+0.6% after −0.3%).
tableauTab2 – Production, consumption and GFCF: main components
| 2017 Q3 | 2017 Q4 | 2018 Q1 | 2018 Q2 | 2017 | 2018 (ovhg) | |
|---|---|---|---|---|---|---|
| Production of branches | 0.8 | 0.9 | 0.1 | 0.2 | 2.6 | 1.5 |
| Goods | 0.9 | 1.1 | -0.6 | -0.3 | 2.2 | 0.6 |
| Manufactured Industry | 0.9 | 1.3 | -1.0 | -0.2 | 2.4 | 0.4 |
| Construction | 0.5 | 0.5 | -0.3 | 0.6 | 3.5 | 1.0 |
| Market services | 0.9 | 1.0 | 0.5 | 0.4 | 3.2 | 2.2 |
| Non-market services | 0.5 | 0.4 | 0.2 | 0.4 | 1.1 | 1.2 |
| Household consumption | 0.4 | 0.2 | 0.2 | -0.1 | 1.1 | 0.5 |
| Food products | -0.5 | 0.1 | -0.3 | -1.3 | 0.3 | -1.2 |
| Energy | 1.1 | -0.6 | 0.8 | -1.7 | 0.1 | 0.0 |
| Engineered goods | 1.2 | 0.0 | -0.3 | 1.2 | 2.6 | 1.2 |
| Services | 0.5 | 0.5 | 0.4 | 0.1 | 1.6 | 1.1 |
| GFCF | 1.4 | 0.9 | 0.1 | 0.7 | 4.7 | 2.3 |
| Manufactured goods | 2.0 | 1.7 | -1.1 | 1.2 | 3.7 | 2.0 |
| Construction | 0.7 | 0.3 | 0.1 | 0.7 | 3.5 | 1.5 |
| Market services | 2.0 | 1.3 | 1.0 | 0.5 | 7.0 | 3.5 |
- Source: INSEE
Household consumption faltered
Household consumption expenditure faltered slightly in Q1 2018 (−0.1% after +0.2%): consumption of goods declined again (−0.3% after −0.1%) and that of services slowed down sharply (+0.1% after +0.4%).
In particular, consumption of food products braked (−1.3% after −0.3%), as expenditures on energy (−1.7% after +0.8%) because of temperatures higher than the seasonal norms in April.
In services, the slow down was notably driven by the downturn in transport expenses (−3.2% after +1.0%), mainly in rail transport as a result of strikes.
tableauTab3 – Sectoral accounts
| 2017 Q3 | 2017 Q4 | 2018 Q1 | 2018 Q2 | 2017 | 2018 (ovhg) | |
|---|---|---|---|---|---|---|
| Profit ratio of NFCs* (level) | 32.1 | 32.0 | 31.9 | 32.0 | ||
| Households' purchasing power | 0.4 | 0.1 | -0.6 | 1.4 | -0.1 |
- *NFCs: non-financial corporations
- Source: INSEE
tableauTab4 – Households' disposable income and ratios of households' account
| 2017 Q3 | 2017 Q4 | 2018 Q1 | 2018 Q2 | 2017 | 2018 (ovhg) | |
|---|---|---|---|---|---|---|
| HDI | 0.6 | 0.6 | 0.0 | 2.7 | 0.9 | |
| Household purchasing power | 0.4 | 0.1 | -0.6 | 1.4 | -0.1 | |
| HDI by cu* (purchasing power) | 0.3 | 0.0 | -0.7 | 0.9 | -0.4 | |
| Adjusted HDI (purchasing power) | 0.5 | 0.2 | -0.4 | 1.5 | 0.1 | |
| Saving rate (level) | 14.3 | 14.3 | 13.6 | 14.2 | ||
| Financial saving rate (level) | 4.4 | 4.5 | 3.5 | 4.4 |
- *cu: consumption unit
- Source: INSEE
Corporate investment accelerated, household investment was almost stable
In Q2 2018, total GFCF recovered sharply (+0.7% after +0.1% in Q1 2018), especially because of the upsurge in corporate investment (+1.1% after +0.1%). It was mainly due to the upswing in manufactured goods (+1.2% after −1.1%). Conversely, household investment weakened slightly (−0.1% after +0.2%).
tableauTab5 – Ratios of non-financial corporations' account
| 2017 Q3 | 2017 Q4 | 2018 Q1 | 2018 Q2 | 2017 | |
|---|---|---|---|---|---|
| Profit share | 32.1 | 32.0 | 31.9 | 32.0 | |
| Investment ratio | 23.5 | 23.6 | 23.6 | 23.5 | |
| Savings ratio | 23.0 | 22.4 | 22.8 | 22.5 | |
| Self-financing ratio | 97.7 | 94.7 | 96.6 | 95.9 |
- Source: INSEE
Foreign trade balance contributed negatively to GDP this quarter
Imports recovered sharply in Q2 2018 (+1.7% after −0.3%) after the decrease observed in Q1. Exports also bounced back but to a lesser extent (+0.6% after −0.4%). All in all, foreign trade balance contributed negatively to GDP growth: −0.3 points after a neutral contribution in the previous quarter.
tableauTab6 – Expenditure, receipts and net borrowing of public administrations
| 2017 Q3 | 2017 Q4 | 2018 Q1 | 2018 Q2 | 2017 | |
|---|---|---|---|---|---|
| In billions of euros | |||||
| Total expenditure | 324.6 | 327.5 | 329.2 | 1292.5 | |
| Total receipts | 309.0 | 314.2 | 315.1 | 1232.8 | |
| Net lending (+) or borrowing (–) | -15.6 | -13.4 | -14.0 | -59.7 | |
| In % of GDP | |||||
| Net lending (+) or borrowing (–) | -2.7 | -2.3 | -2.4 | -2.6 |
- Source: INSEE
Revisions
GDP growth estimate for Q1 2018 is confirmed at +0.2%. Slight revisions in different aggregates offset each other; they are mainly due to the revision of indicators and to the update of seasonal adjustment coefficients.
Avertissement
Quarterly national accounts
Quarterly debt of the general government
Sources
Quarterly national accounts
Quarterly accounts are a consistent set of indicators which provides a global overview of recent economic activity.
Time series of the main aggregates of quarterly national accounts can be accessed through the "Summary". They are classified into eight categories:
- Gross domestic product (GDP) and main economic aggregates ;
- Goods and services ;
- Households' consumption ;
- Foreign trade ;
- Activities ;
- Institutional sectors ;
- Households' income and purchasing power ;
- Public finances.
For each category, are available :
- synthetic files displaying from the accounts the relevant information for economic analysis ,
- sometimes, one or two files displaying all the data available.
Documentation
Abbreviated methodology (pdf, 140 Ko )
Methodology - First estimate at 30 days (pdf, 112 Ko )