


 12 September 2017
2017- n° 238In Q2 2017, the increase in payroll employment remained robust Payroll employment - second quarter 2017
12 September 2017
2017- n° 238In Q2 2017, the increase in payroll employment remained robust Payroll employment - second quarter 2017
In Q2 2017, net payroll job creation reached 81,400, that is an increase of 0.3% as in the previous quarter. It is the eleventh consecutive quarter of growth. The payroll employment increased by 76,800 in the private sector and by 4,600 in the public sector. Year on year, it rose by 303,500 net jobs (that is +1.2%) : 276,300 jobs were created in the private sector and 27,200 jobs in the public service.

Warning: The introduction of the “Déclaration Sociale Nominative” (DSN) to replace the “bordereau récapitulatif de cotisations” (BRC) may affect transitorily the declarative behavior of businesses. During the ramp-up phase of the DSN, adjustments are made in the statistical processing chain of employment estimates to reflect these changes. These changes are likely to generate more revisions than usual to data.
Payroll employment continued to increase steadily in Q2 2017
In Q2 2017, net payroll job creation reached 81,400, that is an increase of 0.3% as in the previous quarter. It is the eleventh consecutive quarter of growth. The payroll employment increased by 76,800 in the private sector and by 4,600 in the public sector. Year on year, it rose by 303,500 net jobs (that is +1.2%) : 276,300 jobs were created in the private sector and 27,200 jobs in the public service.
The employment declined less in industry and it increased again in construction
In Q2 2017, the decline in payroll employment in industry eased slightly: −2,800 (that is −0.1%), after –4,900 in the previous quarter. Year on year, industry lost 13,500 jobs (that is −0.4%).
By contrast, payroll employment in construction increased for the second consecutive quarter, while it had dropped almost continuously since 2008. In this sector, net job creation reached 4,800 in Q2 2017 (that is +0.4%), after +9,800 in Q1 2017. Year on year, the employment recovery in construction has been confirmed : +8,600 jobs, that is +0.6%.
Payroll employment continued to increase clearly in market services
In Q2 2017, payroll employment increased by 67,000 (that is +0.6%, after +0.4% in the previous quarter). Year on year, substantially more jobs were created in the market service sector as a whole than destroyed : +259,400, that is +2.2%.
Temporary employment picked up in Q2 2017: it rose by 23,200 jobs i.e. +3.4% after it decreased by 0,6% in Q1 2017. Over a year, it increased very sharply: +105,000, that is +17,4%.
Employment in services excluding temporary work slowed down slightly in Q2 2017 : +43,800 jobs, i.e. 0.4 %, after +0.5% in the previous quarter. Over a year, the market service sector excluding temporary work expanded by 154,400 jobs (+1.4%).
tableautableau_1 – Payroll employment change: thousands
| Change in 3 months | Change in 1 year | Level | ||
|---|---|---|---|---|
| 2017 | 2017 | 2017 | 2017 | |
| Q1 | Q2 | Q2 | Q2 | |
| Agriculture | 1.0 | 2.9 | 2.6 | 298.3 |
| Goods-producing industries excl. Construction | -4.9 | -2.8 | -13.5 | 3, 139.3 |
| of which : Manufacturing | -1.6 | -1.9 | -5.4 | 2, 772.8 |
| Construction | 9.4 | 4.8 | 8.6 | 1, 347.7 |
| Market services (*) | 47.9 | 67.0 | 259.4 | 12, 133.3 |
| of which : Temporary employment (**) | -4.3 | 23.2 | 105.0 | 709.4 |
| Non-market services | 19.5 | 9.5 | 46.4 | 8 085.8 |
| Total (*) | 72.8 | 81.4 | 303.5 | 25, 004.4 |
| Private sector (*) | 58.8 | 76.8 | 276.3 | 19, 186.2 |
| Public service | 14.0 | 4.6 | 27.2 | 5, 818.3 |
- How to read it: In Q 2017, net job creation in market services amounted to 67, 000 jobs from the previous quarter
tableautableau_2 – Payroll employment change: percentage
| Change in 3 months | Change in 1 year | ||
|---|---|---|---|
| 2017 | 2017 | 2017 | |
| Q1 | Q2 | Q2 | |
| Agriculture | 0.3 | 1.0 | 0.9 |
| Goods-producing industries excl. Construction | -0.2 | -0.1 | -0.4 |
| of which : Manufacturing | -0.1 | -0.1 | -0.2 |
| Construction | 0.7 | 0.4 | 0.6 |
| Market services (*) | 0.4 | 0.6 | 2.2 |
| of which : Temporary employment (**) | -0.6 | 3.4 | 17.4 |
| Non-market services | 0.2 | 0.1 | 0.6 |
| Total (*) | 0.3 | 0.3 | 1.2 |
| Private sector (*) | 0.3 | 0.4 | 1.5 |
| Public service | 0.2 | 0.1 | 0.5 |
- (*) Excl. extraterritorial activities
- (**) Temporary workers are recorded in services, regardless of the sector in which they carry out their mission effectively.
- Source: Acoss-Urssaf, Dares, INSEE
Employment slowed slightly in non-market services
Employment in mainly non-market services slowed slightly in Q2 2017: it increased by 9,500, (that is +0,1%), after +19,500 in the previous quarter. Over a year, these sectors created 46,400 net jobs (that is +0.6%), of which 22,300 were in the private sector.
Revisions
Compared to the employment estimate published on 13 June 2017, net job creation has been revised downwards by 16,900 mainly due to the downward revision in temporary employment. Compared to the flash estimate focused on the private sector alone published on 11 August 2017, net job creation in Q2 2017 has been revised downwards by 14,900, particularly in market services.
tableautableau_3 – Payroll employment change (*)
| Code | Change in | Level | |||
|---|---|---|---|---|---|
| 3 months | 1 year | ||||
| NAF | 2017 | 2017 | 2017 | 2017 | |
| rév.2 | Q1 | Q2 | Q2 | Q2 | |
| AZ | Agriculture | 1.0 | 2.9 | 2.6 | 298.3 |
| DE | Electricity, gas, steam, and air conditioning supply ; water supply, sewerage, waste management and remediation activities | -3.3 | -0.9 | -8.1 | 366.5 |
| C1 | Manufacture of food products beverage and tobacco products | 1.7 | 1.8 | 4.4 | 570.3 |
| C2 | Manufacture of coke, and refined petroleum products | -0.1 | -0.1 | -0.2 | 9.4 |
| C3 | Manufacture of computer, electronic and electrical products; manufacture of machinery and equipment | -1.1 | -0.9 | -3.5 | 416.9 |
| C4 | Manufacture of transport equipment | -0.1 | -0.8 | 1.1 | 347.4 |
| C5 | Other manufacturing | -2.0 | -2.0 | -7.3 | 1 428.8 |
| FZ | Construction | 9.4 | 4.8 | 8.6 | 1 347.7 |
| GZ | Wholesale and retail trade ; repair of motor vehicles and motorcycles | 4.6 | 9.1 | 23.4 | 3 132.3 |
| HZ | Transportation and storage | 4.3 | 2.9 | 10.6 | 1 390.6 |
| IZ | Accommodation and food service activities | 13.7 | 13.5 | 38.8 | 1 085.3 |
| JZ | Information and communication | 5.8 | 2.3 | 16.7 | 749.4 |
| KZ | Financial and insurance activities | 1.0 | -0.1 | 1.3 | 869.5 |
| LZ | Real estate activities | -1.3 | -0.5 | -0.6 | 240.5 |
| MN | Professional, scientific and technical activities; administrative and support service activities | 15.7 | 38.0 | 159.0 | 3 322.1 |
| of which : Temporary employment | -4.3 | 23.2 | 105.0 | 709.4 | |
| OQ | Public administration and defence ; compulsory social security; education; human health and social work activities | 19.5 | 9.5 | 46.4 | 8 085.8 |
| RU | Other service activities | 4.2 | 1.8 | 10.1 | 1 343.7 |
- (*) Excl. extraterritorial activities.
- Sources: Acoss-Urssaf, Dares, INSEE
tableautableau_4 – Revisions of payroll employment in Q1 2017
| Change in 3 months | Change in 1 year | |||
|---|---|---|---|---|
| New estimate | Revision | New estimate | Revision | |
| Agriculture | 1.0 | 0.2 | 3.5 | -1.4 |
| Goods-producing industries Construction | -4.9 | 0.3 | -19.4 | 0.3 |
| of which : Manufacturing | -1.6 | 0.3 | -10.8 | 0.3 |
| Construction | 9.4 | 0.1 | 1.8 | 0.1 |
| Market services (*) | 47.9 | -23.7 | 236.8 | -9.9 |
| of which : Temporary work employment (**) | -4.3 | -21.3 | 87.3 | -5.7 |
| Non-market services | 19.5 | 6.4 | 53.3 | 2.8 |
| Total (*) | 72.8 | -16.9 | 276.0 | -8.1 |
| Private sector (*) | 58.8 | -21.5 | 246.4 | -9.0 |
| Public service | 14.0 | 4.5 | 29.6 | 0.9 |
- (*) Excl. extraterritorial activities.
- Sources: Acoss-Urssaf, Dares, INSEE
graphiquegraphique – Variation in payroll employment in thousands (*)
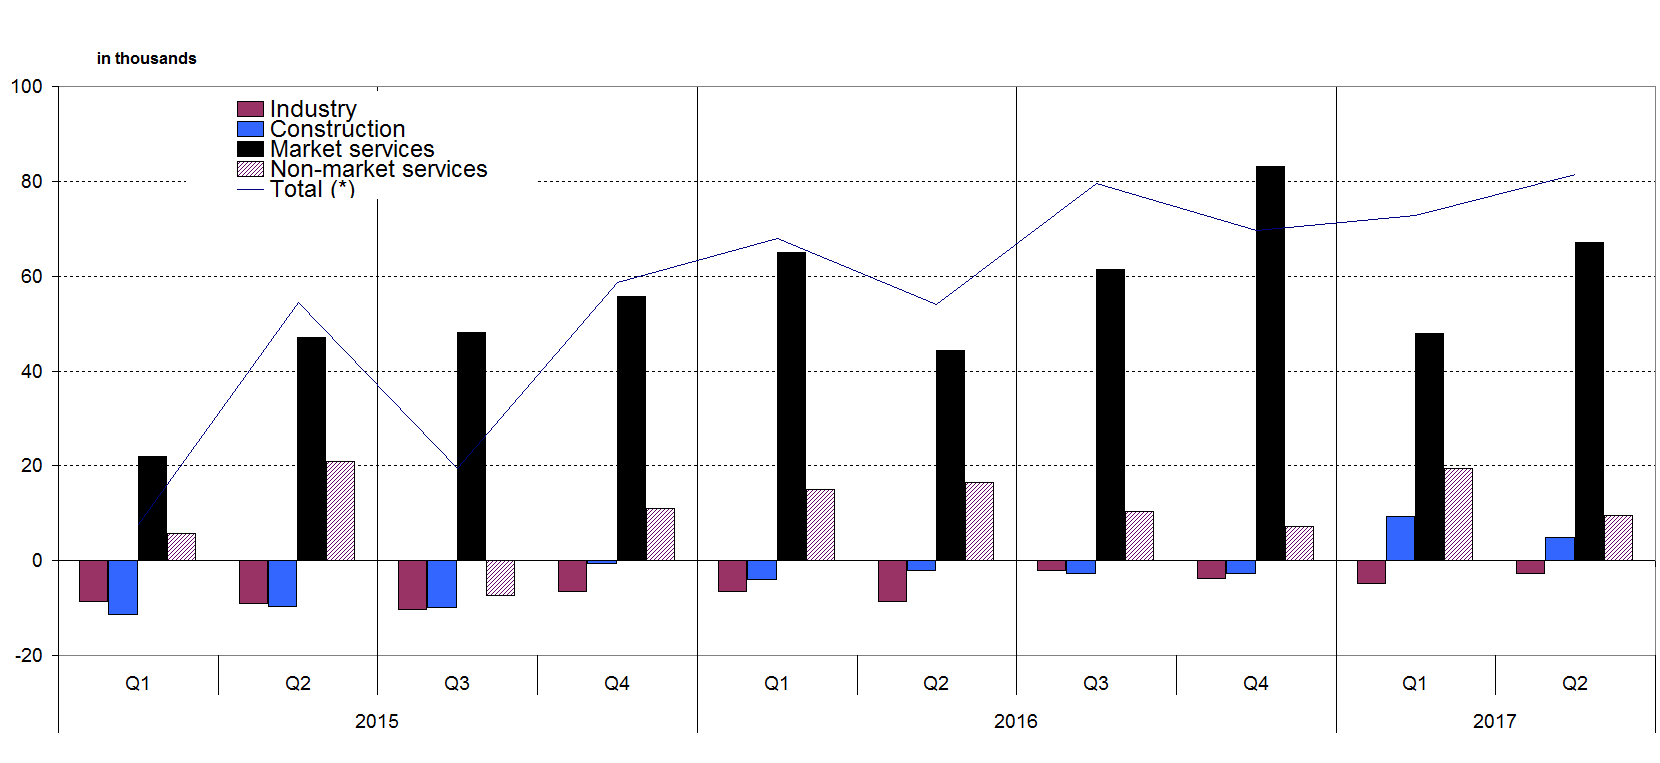
- Scope : France excluding Mayotte.
- (*) Excl. extraterritorial activities.
- Sources: Acoss-Urssaf, Dares, INSEE
Pour en savoir plus
