


Quarterly national accounts in Q4 2016 National accounts in base 2010 - Detailed figures
In Q4 2016, households' purchasing power decelerated Quarterly national accounts - detailed figures - fourth quarter 2016
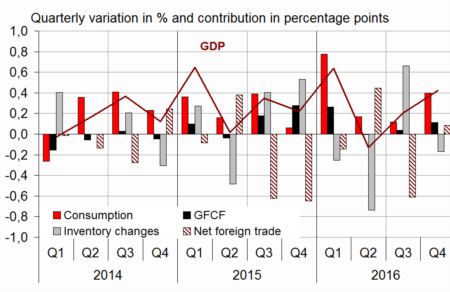
In Q4 2016, GDP in volume terms* accelerated: +0.4%, after +0.2% in Q3. On average over the year, GDP rose by 1.1%, practically as much as in 2015 (+1.2%). Without working day adjustment, GDP growth amounts to +1.2% in 2016, after +1.3% in 2015.
Household consumption expenditures accelerated in Q4 (+0.6% after +0.1%), as well as total gross fixed capital formation (GFCF; +0.5% after +0.2%). All in all, final domestic demand excluding inventory changes was more dynamic and contributed more to GDP growth: +0.5 points after +0.2 points.
Exports were more vigorous (+1.3% after +0.8%) while imports slowed down (+0.9% after +2.7%). All in all, foreign trade balance contributed slightly positively to GDP growth in Q4: +0.1 points after −0.6 points. Conversely, changes in inventories contributed negatively (−0.2 points after +0.7 points).

* This growth rate is seasonally and working-day adjusted; volumes are chain-linked previous-year-prices volumes.
graphiqueGraph – GDP and its main components
tableauTab1 – Goods and services: supply and uses chain-linked volumes
| 2016 Q1 | 2016 Q2 | 2016 Q3 | 2016 Q4 | 2015 | 2016 | |
|---|---|---|---|---|---|---|
| GDP | 0.6 | -0.1 | 0.2 | 0.4 | 1.2 | 1.1 |
| Imports | 0.4 | -1.4 | 2.7 | 0.9 | 6.4 | 3.6 |
| Household consumption *expenditure | 1.3 | 0.1 | 0.1 | 0.6 | 1.5 | 1.8 |
| General government's *consumption expenditure | 0.4 | 0.4 | 0.3 | 0.3 | 1.4 | 1.4 |
| GFCF | 1.2 | 0.0 | 0.2 | 0.5 | 0.9 | 2.8 |
| *of which Non-financial corporated and unincorporated enterprises | 2.1 | -0.1 | -0.1 | 0.8 | 2.7 | 4.0 |
| Households | 0.6 | 0.5 | 0.7 | 0.8 | -0.8 | 2.1 |
| General government | -0.9 | -0.6 | 0.3 | -1.1 | -3.9 | -0.7 |
| Exports | -0.2 | 0.0 | 0.8 | 1.3 | 6.0 | 1.2 |
| Contributions : | ||||||
| Internal demand excluding inventory changes | 1.0 | 0.2 | 0.2 | 0.5 | 1.3 | 1.9 |
| Inventory changes | -0.3 | -0.7 | 0.7 | -0.2 | 0.2 | 0.0 |
| Net foreign trade | -0.1 | 0.4 | -0.6 | 0.1 | -0.3 | -0.8 |
- Source: Insee
Purchasing power slowed down in Q4 2016 yet accelerated over the year
Households' gross disposable income (GDI) decelerated in Q4 2016 (+0.4% after +0.7%) mostly because of a rebound of taxes on income and wealth. Indeed, income tax started to rise again (+1.3%) after a decrease in Q3 2016 (-1.1%) linked to tax measures lowering taxes for modest income households.
Furthermore social benefits in cash decelerated slightly (+0.3% after +0.5% in Q3), the ramp-up of activity premium coming progressively to an end. Households' social contributions increased virtually at the same pace as in Q3 2016 (+0.7% after +0.6%).
Conversely, earned income was slightly more dynamic: total gross wages accelerated in Q4 2016 (+0.7% after +0.5%), due to employment and average wage per capita.
Household consumption prices accelerated slightly in Q4 2016 (+0.3 after +0.1%), so that households' purchasing power slowed more sharply than GDI (+0.1% after +0.6%). However, over the year, it accelerated (+1.9% after +1.6% in 2015). Measured per consumption unit, it increased by 1.4% in 2016 after 1.2% in 2015.
As households' consumption in volume terms was more dynamic than their purchasing power, their saving ratio declined in Q4: it stood at 14.5% of their GDI, after 14.9% in Q3. On average over the year, it was stable at 14.5%.
Non-financial corporations' profit ratio was virtually stable at 31.5% in Q4 2016
In Q4 2016, non-financial corporations' profit ratio was virtually stable at 31.5% (after 31.6%). Real wages increased slightly more than productivity gains while the hiring premium for SMEs has been ramping up.
On average over the year, non-financial corporations' profit ratio rose by 0.3 points, and reached 31.7% in 2016. The improvement in the terms of trade due to the decrease in energy prices as well as the cut in social contributions sustained it. Conversely, real wages increased more than productivity, which limited its progression.
General government deficit decreased in Q4
General government deficit decreased by 0.6 points of GDP in Q4 2016, and reached 3.2% after 3.8%. Over the year, it accounted for 3.4% of GDP (an estimation in line with the first annual account estimate notified to the European Commission).
Spending stepped back in Q4. On the one hand, France contribution to European budget diminished following the integration of the last amending budgets. On the other hand, government debt servicing fell back.
On its side, revenue accelerated in Q4 as a result of the momentum of tax on income and wealth paid by corporates and households. Furthermore, social contributions accelerated, in tune with total gross wages.
tableauTab2 – Sectoral accounts
| 2016 Q1 | 2016 Q2 | 2016 Q3 | 2016 Q4 | 2015 | 2016 | |
|---|---|---|---|---|---|---|
| Profit ratio of NFCs* (level) | 32.0 | 31.6 | 31.6 | 31.5 | 31.4 | 31.7 |
| Households' purchasing power | 0.6 | 0.3 | 0.6 | 0.1 | 1.6 | 1.9 |
- *NFCs: non-financial corporations
- Source: INSEE
tableauTab3 – Production, consumption and GFCF: main components
| 2016 Q1 | 2016 Q2 | 2016 Q3 | 2016 Q4 | 2015 | 2016 | |
|---|---|---|---|---|---|---|
| Production of branches | 0.7 | -0.2 | 0.4 | 0.6 | 1.3 | 1.4 |
| Goods | 0.2 | -0.7 | 0.1 | 1.0 | 1.2 | 0.1 |
| Manufactured Industry | 0.4 | -1.1 | 0.6 | 0.7 | 1.5 | 0.5 |
| Construction | 0.4 | -0.3 | 0.9 | 0.2 | -2.2 | 0.7 |
| Market services | 1.1 | -0.1 | 0.6 | 0.6 | 1.8 | 2.2 |
| Non-market services | 0.4 | 0.3 | 0.2 | 0.2 | 1.0 | 1.2 |
| Household consumption | 1.3 | 0.1 | 0.1 | 0.6 | 1.5 | 1.8 |
| Food products | 0.5 | -0.6 | 0.8 | -0.4 | 1.2 | 0.8 |
| Energy | 1.9 | 2.1 | -1.4 | 3.8 | 1.4 | 1.8 |
| Engineered goods | 2.2 | 0.3 | -1.1 | 0.9 | 2.6 | 2.4 |
| Services | 0.9 | -0.2 | 0.5 | 0.3 | 1.0 | 1.5 |
| GFCF | 1.2 | 0.0 | 0.2 | 0.5 | 0.9 | 2.8 |
| Manufactured goods | 2.5 | -0.1 | -2.3 | 1.3 | 2.1 | 5.5 |
| Construction | 0.4 | -0.1 | 0.6 | 0.2 | -2.2 | 0.9 |
| Market services | 1.4 | 0.2 | 1.3 | 0.5 | 4.4 | 3.5 |
- Source: INSEE
tableauTab4 – Households' disposable income and ratios of households' account
| 2016 Q1 | 2016 Q2 | 2016 Q3 | 2016 Q4 | 2015 | 2016 | |
|---|---|---|---|---|---|---|
| HDI | 0.5 | 0.3 | 0.7 | 0.4 | 1.4 | 1.9 |
| Household purchasing power | 0.6 | 0.3 | 0.6 | 0.1 | 1.6 | 1.9 |
| HDI by cu* (purchasing power) | 0.5 | 0.1 | 0.5 | 0.0 | 1.2 | 1.4 |
| Adjusted HDI (purchasing power) | 0.5 | 0.3 | 0.6 | 0.1 | 1.6 | 1.8 |
| Saving rate (level) | 14.3 | 14.4 | 14.9 | 14.5 | 14.5 | 14.5 |
| Financial saving rate (level) | 5.4 | 5.3 | 5.7 | 5.2 | 5.5 | 5.4 |
- *cu: consumption unit
- Source: INSEE
tableauTab5 – Ratios of non-financial corporations' account
| 2016 Q1 | 2016 Q2 | 2016 Q3 | 2016 Q4 | 2015 | 2016 | |
|---|---|---|---|---|---|---|
| Profit share | 32.0 | 31.6 | 31.6 | 31.5 | 31.4 | 31.7 |
| Investment ratio | 23.3 | 23.4 | 23.4 | 23.4 | 22.9 | 23.4 |
| Savings ratio | 21.2 | 20.6 | 20.7 | 20.6 | 19.7 | 20.8 |
| Self-financing ratio | 90.8 | 87.9 | 88.6 | 87.7 | 86.3 | 88.7 |
- Source: INSEE
tableauTab6 – Expenditure, receipts and net borrowing of public administrations
| 2016 Q1 | 2016 Q2 | 2016 Q3 | 2016 Q4 | 2015 | 2016 | |
|---|---|---|---|---|---|---|
| In billions of euros | ||||||
| Total expenditure | 312.6 | 313.9 | 315.7 | 314.9 | 1244.0 | 1257.0 |
| Total receipts | 294.2 | 295.1 | 294.8 | 297.2 | 1165.3 | 1181.3 |
| Net lending (+) or borrowing (-) | -18.4 | -18.7 | -21.0 | -17.7 | -78.7 | -75.7 |
| In % of GDP | ||||||
| Net lending (+) or borrowing (-) | -3.3 | -3.4 | -3.8 | -3.2 | -3.6 | -3.4 |
Revisions
The estimate of GDP growth in Q4 2016 is confirmed at +0.4% and at +1.1%in 2016 as a whole. Slight revisions in different aggregates offset each other; they are mainly due to the integration of new indicators and to the update of seasonal adjustment coefficients.
Avertissement
Quarterly national accounts
Quarterly debt of the general government
Sources
Quarterly national accounts
Quarterly accounts are a consistent set of indicators which provides a global overview of recent economic activity.
Time series of the main aggregates of quarterly national accounts can be accessed through the "Summary". They are classified into eight categories:
- Gross domestic product (GDP) and main economic aggregates ;
- Goods and services ;
- Households' consumption ;
- Foreign trade ;
- Activities ;
- Institutional sectors ;
- Households' income and purchasing power ;
- Public finances.
For each category, are available :
- synthetic files displaying from the accounts the relevant information for economic analysis ,
- sometimes, one or two files displaying all the data available.
Documentation
Abbreviated methodology (pdf, 140 Ko )
Methodology - First estimate at 30 days (pdf, 112 Ko )