


Quarterly national accounts in Q4 2016 National accounts in base 2010 - Detailed figures
French GDP increased by 0.4% in Q4 2016 and by 1.1% over the year Quarterly national accounts - second estimate - fourth quarter 2016
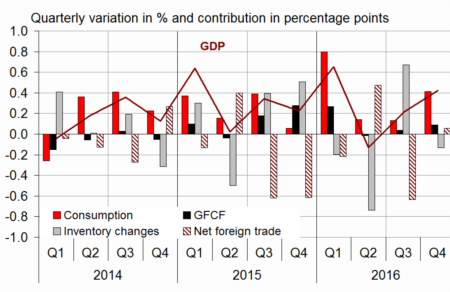
In Q4 2016, GDP in volume terms* accelerated: +0.4%, after +0.2% in Q3. On average over the year, GDP rose by 1.1%, practically as much as in 2015 (+1.2%). Without working day adjustment, GDP growth amounts to +1.2% in 2016, after +1.3% in 2015.
Household consumption expenditures accelerated in Q4 (+0.6% after +0.1%), as well as total gross fixed capital formation (GFCF; +0.4% after +0.2%). All in all, final domestic demand excluding inventory changes gathered momentum, contributing more to GDP growth: +0.5 points after +0.2 points.
Exports were more dynamic (+1.3% after +0.8%) while imports slowed down (+1.0% after +2.7%). All in all, foreign trade balance contributed slightly to GDP growth in Q4: +0.1 points after −0.6 points. Conversely, changes in inventories contributed negatively (−0.1 points after +0.7 points).

* This growth rate is seasonally and working-day adjusted; volumes are chain-linked previous-year-prices volumes.
graphiqueGraph – GDP and its main components
- Source: INSEE
tableauTab1 – Goods and services: supply and uses chain-linked volumes
| 2016 Q1 | 2016 Q2 | 2016 Q3 | 2016 Q4 | 2015 | 2016 | |
|---|---|---|---|---|---|---|
| GDP | 0.7 | -0.1 | 0.2 | 0.4 | 1.2 | 1.1 |
| Imports | 0.6 | -1.5 | 2.7 | 1.0 | 6.4 | 3.7 |
| Household consumption *expenditure | 1.3 | 0.1 | 0.1 | 0.6 | 1.5 | 1.8 |
| General government's *consumption expenditure | 0.4 | 0.4 | 0.3 | 0.4 | 1.4 | 1.5 |
| GFCF | 1.2 | -0.1 | 0.2 | 0.4 | 0.9 | 2.7 |
| *of which Non-financial corporated and unincorporated enterprises | 2.1 | -0.1 | -0.1 | 0.8 | 2.7 | 4.0 |
| Households | 0.6 | 0.5 | 0.7 | 0.7 | -0.8 | 2.0 |
| General government | -0.8 | -0.6 | 0.1 | -1.5 | -3.9 | -0.6 |
| Exports | -0.2 | 0.0 | 0.8 | 1.3 | 6.0 | 1.1 |
| Contributions : | ||||||
| Internal demand excluding inventory changes | 1.1 | 0.1 | 0.2 | 0.5 | 1.3 | 1.9 |
| Inventory changes | -0.2 | -0.7 | 0.7 | -0.1 | 0.2 | 0.0 |
| Net foreign trade | -0.2 | 0.5 | -0.6 | 0.1 | -0.3 | -0.8 |
- Source: Insee
Total production rose again
Total production in goods and services accelerated slightly in Q4 (+0.6% after +0.5%), thanks to a strong rebound in energy (+2.3% after −2.3%). It rose slightly more than in Q3 in manufacturing industry (+0.8% after +0.7%) and increased at the same pace in market services (+0.6%). By contrast, activity in construction decelerated (+0.2% after +0.9%).
On average over the year, total production increased a little more than in 2015 (+1.4% after +1.3%): it bounced back in construction (+0.7% after −2.2%) and accelerated in market services (+2.2% after +1.8%), but it slowed down in energy (+1.2% after +1.8%) and in the manufacturing industry (+0.6% after +1.5%). Agricultural production decreased sharply (−5.7% after −2.2%), due to adverse weather conditions.
Household consumption recovered
Household consumption accelerated in Q4 2016 (+0.6% after +0.1%). Expenditure in engineered goods bounced back (+0.9% after −1.1%), particularly in cars. Energy consumption accelerated sharply (+3.7% after −1.5%), mainly due to gas and electricity, because temperatures were below the seasonal norms. However, services consumption slowed a little (+0.3% after +0.5%).
On average over the year, household consumption rose more in 2016 than in 2015 (+1.8% after +1.5%), notably buoyed by household expenditure in home equipment in the first half of 2016.
Corporate investment picked up sharply at the end of 2016
In Q4, total GFCF accelerated slightly (+0.4% after +0.2%), because of non-financial corporations. Investment in manufactured goods rebounded sharply (+1.3% after −2.4%), mainly in transport equipment. However, investment in market services slowed down (+0.3% after +1.3%), as that in construction (0.0% after +0.6%), notably due to the decrease in civil engineering.
Over the whole of 2016, total GFCF accelerated sharply: +2.7% after +0.9%.
Foreign trade balance stimulated GDP growth at the end of 2016 but weighed down on it on average in 2016
In Q4, exports accelerated (+1.3% after +0.8%), notably in transport equipment. In the same time, imports decelerated (+1.0% after +2.7%). In particular, raw hydrocarbons and manufactured goods purchases slowed sharply. All in all, external exchanges provided a slightly positive contribution to GDP growth: +0.1 points after −0.6 points.
On average over the year 2016, imports slowed down (+3.7% after +6.4%), but much less than exports (+1.1% after +6.0%). Consequently, foreign trade balance contributed more negatively to GDP growth in 2016 than in 2015 (−0.8 points after −0.3 points).
The contribution of inventory changes was slightly negative in Q4
In Q4 2016, the contribution of changes in inventories to GDP growth was −0.1 points (after +0.7 points), mainly due to “other industrial products” (pharmacy and steel products notably).
Over the year, the contribution of changes in inventories to GDP growth was neutral, after +0.2 points in 2015.
tableauTab3 – Production, consumption and GFCF: main components
| 2016 Q1 | 2016 Q2 | 2016 Q3 | 2016 Q4 | 2015 | 2016 | |
|---|---|---|---|---|---|---|
| Production of branches | 0.7 | -0.2 | 0.5 | 0.6 | 1.3 | 1.4 |
| Goods | 0.2 | -0.7 | 0.1 | 1.0 | 1.2 | 0.1 |
| Manufactured Industry | 0.3 | -1.0 | 0.7 | 0.8 | 1.5 | 0.6 |
| Construction | 0.4 | -0.3 | 0.9 | 0.2 | -2.2 | 0.7 |
| Market services | 1.1 | -0.1 | 0.6 | 0.6 | 1.8 | 2.2 |
| Non-market services | 0.4 | 0.3 | 0.3 | 0.3 | 1.0 | 1.3 |
| Household consumption | 1.3 | 0.1 | 0.1 | 0.6 | 1.5 | 1.8 |
| Food products | 0.4 | -0.6 | 0.8 | -0.4 | 1.2 | 0.7 |
| Energy | 2.3 | 1.8 | -1.5 | 3.7 | 1.4 | 1.8 |
| Engineered goods | 2.3 | 0.3 | -1.1 | 0.9 | 2.6 | 2.5 |
| Services | 0.9 | -0.2 | 0.5 | 0.3 | 1.0 | 1.5 |
| GFCF | 1.2 | -0.1 | 0.2 | 0.4 | 0.9 | 2.7 |
| Manufactured goods | 2.5 | -0.1 | -2.4 | 1.3 | 2.1 | 5.5 |
| Construction | 0.5 | -0.1 | 0.6 | 0.0 | -2.2 | 0.8 |
| Market services | 1.4 | 0.1 | 1.3 | 0.3 | 4.4 | 3.5 |
- Source: INSEE
tableauTab2 – Sectoral accounts
| 2016 Q1 | 2016 Q2 | 2016 Q3 | 2016 Q4 | 2015 | 2016 (ovhg) | |
|---|---|---|---|---|---|---|
| Profit ratio of NFC* (level) | 32.0 | 31.6 | 31.6 | 31.4 | ||
| Household purchasing power | 0.6 | 0.3 | 0.7 | 1.6 | 1.9 |
- *NFC: non-financial corporations
- Source: INSEE
tableauTab4 – Households' disposable income and ratios of households' account
| 2016 Q1 | 2016 Q2 | 2016 Q3 | 2016 Q4 | 2015 | 2016 (ovhg) | |
|---|---|---|---|---|---|---|
| HDI | 0.5 | 0.3 | 0.8 | 1.4 | 1.9 | |
| Household purchasing power | 0.6 | 0.3 | 0.7 | 1.6 | 1.9 | |
| HDI by cu* (purchasing power) | 0.5 | 0.2 | 0.6 | 1.2 | 1.5 | |
| Adjusted HDI (purchasing power) | 0.6 | 0.3 | 0.6 | 1.6 | 1.8 | |
| Saving rate (level) | 14.3 | 14.5 | 15.0 | 14.5 | ||
| Financial saving rate (level) | 5.5 | 5.4 | 5.9 | 5.5 |
- *cu: consumption unit
- Source: INSEE
tableauTab5 – Ratios of non-financial corporations' account
| 2016 Q1 | 2016 Q2 | 2016 Q3 | 2016 Q4 | 2015 | |
|---|---|---|---|---|---|
| Profit share | 32.0 | 31.6 | 31.6 | 31.4 | |
| Investment ratio | 23.3 | 23.4 | 23.3 | 22.9 | |
| Savings ratio | 21.2 | 20.7 | 20.7 | 19.7 | |
| Self-financing ratio | 91.1 | 88.2 | 88.9 | 86.3 |
- Source: INSEE
tableauTab6 – Expenditure, receipts and net borrowing of public administrations
| 2016 Q1 | 2016 Q2 | 2016 Q3 | 2016 Q4 | 2015 | |
|---|---|---|---|---|---|
| In billions of euros | |||||
| Total expenditure | 313.1 | 314.8 | 317.1 | 1242.8 | |
| Total receipts | 295.0 | 296.1 | 295.8 | 1166.3 | |
| Net lending (+) or borrowing (-) | -18.1 | -18.8 | -21.3 | -76.5 | |
| In % of GDP | |||||
| Net lending (+) or borrowing (-) | -3.3 | -3.4 | -3.8 | -3.5 |
- Source: INSEE
Revisions
The estimate of GDP growth in Q4 2016 is confirmed at +0.4%. Slight revisions in different aggregates offset each other; they are mainly due to the integration of new indicators and to the update of seasonal adjustment coefficients.
Avertissement
Quarterly national accounts
Quarterly debt of the general government
Sources
Quarterly national accounts
Quarterly accounts are a consistent set of indicators which provides a global overview of recent economic activity.
Time series of the main aggregates of quarterly national accounts can be accessed through the "Summary". They are classified into eight categories:
- Gross domestic product (GDP) and main economic aggregates ;
- Goods and services ;
- Households' consumption ;
- Foreign trade ;
- Activities ;
- Institutional sectors ;
- Households' income and purchasing power ;
- Public finances.
For each category, are available :
- synthetic files displaying from the accounts the relevant information for economic analysis ,
- sometimes, one or two files displaying all the data available.
Documentation
Abbreviated methodology (pdf, 140 Ko )
Methodology - First estimate at 30 days (pdf, 112 Ko )