


 24 August 2018
2018- n° 221New downturn in business start-ups in July 2018 Enterprise births - July 2018
24 August 2018
2018- n° 221New downturn in business start-ups in July 2018 Enterprise births - July 2018
In July 2018, the number of business births for all enterprises dropped once again (−3.3% after −1.1% in June, seasonally and working-day adjusted). Conventional businesses start-ups shrunk (−3.9% after −1.7%) as well as micro-entrepreneurs' registrations (−2.5% after −0.3%).
In July 2018, the number of business births for all enterprises dropped once again (−3.3% after −1.1% in June, seasonally and working-day adjusted). Conventional businesses start-ups shrunk (−3.9% after −1.7%) as well as micro-entrepreneurs' registrations (−2.5% after −0.3%).
graphiqueGraph1 – Monthly business start-ups (SA-WDA *)
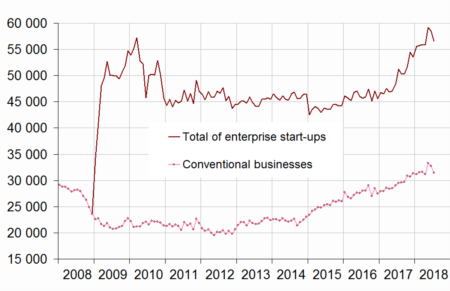
- * Seasonally and working-day adjusted data
- Source: INSEE, REE (Sirene)
tableauTable1 – Business set-ups by month (SA-WDA *)
| April 2018 | May 2018 | June 2018 | July 2018 | |
|---|---|---|---|---|
| Total businesses set-ups | 55,857 | 59,164 | 58,502 | 56,577 |
| Variation [m-o-m] % | -0.1 | 5.9 | -1.1 | -3.3 |
| Conventional businesses | 31,194 | 33,308 | 32,732 | 31,463 |
| Variation [m-o-m] % | -1.3 | 6.8 | -1.7 | -3.9 |
| Self-managed micro-entrepreneurs | 24,664 | 25,855 | 25,770 | 25,114 |
| Variation [m-o-m] % | 1.3 | 4.8 | -0.3 | -2.5 |
- * Seasonally and working-day adjusted data
- Source: INSEE, REE (Sirene)
+16.3% over the twelve last months
The raw number of business start-ups totted up during the last twelve months kept accelerating (+16.3% after +15.6% in June and +13.9% in May). All the types of business start-ups increased: micro-entrepreneurs' registrations (+25.2%), conventional sole proprietorship start-ups (+21.2%) and, to a lesser extent, company births (+2.2%).
Upsurge of business setp-ups in transportation and storage over the three last months
The raw number of business start-ups totted up during the last three months went up sharply (+20.3%). The sector “Transportation and storage” was the one that contributed the most to this rise (rise by +8,300 business start-ups, which comes to a contribution of 5.9 points)1. Within it, the increase was the higher in other activities of post and mail, which includes home-delivery (rise by +7,400 business start-ups).
More than two business set-ups out of five are self-managed micro-entrepreneurs' registrations
In July 2018, the share of micro–entrepreneurs' registrations in the businesses set up over the last twelve months grew for the ninth month in a row and reached 43.0%.
tableauTable0 – Business set-ups distribution by type
| May 2018 | June 2018 | July 2018 | |
|---|---|---|---|
| Companies | 31.1 | 30.6 | 30.3 |
| Sole proprietorships excluding self-managed micro-entrepreneurs | 26.4 | 26.6 | 26.7 |
| Self-managed micro-entrepreneurs | 42.5 | 42.8 | 43.0 |
- Source: INSEE, REE (Sirene)

1 The contribution of a sector to the overall variation is the variation observed in this sector, weighted by the share of this sector in the total number of births.
tableauTable2 – Cumulated business start-ups by type
| Moving total % change * | Moving total | Moving total | ||
|---|---|---|---|---|
| over 3 months | over 12 months | January- July 2018 | January- July 2017 | |
| Total | 20.3 | 16.3 | 409,010 | 343,633 |
| Companies | 1.7 | 2.2 | 121,614 | 120,550 |
| Conventional sole proprietorships | 29.2 | 21.2 | 112,090 | 88,387 |
| Self-managed micro-entrepreneurs | 31.3 | 25.2 | 175,306 | 134,696 |
- * Total of business start-ups during the last 3 or 12 months compared with the same months a year earlier
- Source: INSEE, REE (Sirene)
Revisions
The variation in the overall number of business births in June 2018 has been lowered by 0.5 points to −1.1% due to the revision of raw data and the update of the SA-WDA parameters.
Business set-ups by economic activity
graphiqueGraph2 – Trade and business support activities monthly start-ups (SA-WDA *)
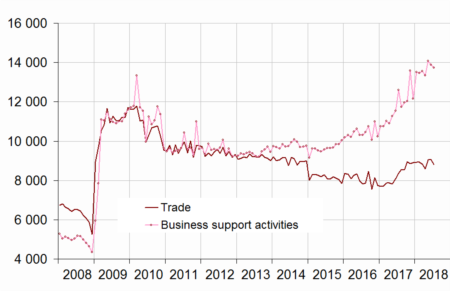
- * Seasonally and working-day adjusted data
- Source: INSEE, REE (Sirene)
graphiqueGraph3 – Construction and transportation business monthly set-ups (SA-WDA *)
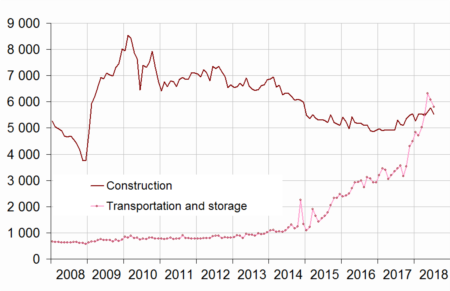
- * Seasonally and working-day adjusted data
- Source: INSEE, REE (Sirene)
tableauTable3 – Number of monthly business set-ups (incl. self-managed micro-entrepreneurs)
| NA | May 2018 | June 2018 | July 2018 | |
|---|---|---|---|---|
| Total | 59,164 | 58,502 | 56,577 | |
| Industry | BE | 2,415 | 2,441 | 2,394 |
| Of which Manufacturing | C | 2,165 | 2,185 | 2,060 |
| Construction | FZ | 5,617 | 5,759 | 5,529 |
| Wholesale and retail trade, Transport, Accommodation and Food and beverage activities | GI | 18,397 | 18,023 | 17,380 |
| Trade | G | 9,057 | 9,051 | 8,804 |
| Transportation and storage | H | 6,329 | 6,080 | 5,806 |
| Accommodation and food service activities | I | 3,012 | 2,892 | 2,770 |
| Information and communication | JZ | 2,877 | 2,913 | 2,769 |
| Financial and insurance activities | KZ | 1,501 | 1,478 | 1,405 |
| Real estate activities | LZ | 2,195 | 2,227 | 2,085 |
| Business support activities | MN | 14,089 | 13,890 | 13,741 |
| Public administration and defence, education, human health and social work activities | OQ | 6,761 | 6,435 | 6,033 |
| Other services activities | RS | 5,311 | 5,337 | 5,241 |
- * Seasonally and working-day adjusted data
- Source: INSEE, REE (Sirene)
tableauTable4 – Fluctuation in the number of business set-ups (incl. self-managed micro-entrepreneurs)
| NA | July 18 / June 18 | Moving total % change** | ||
|---|---|---|---|---|
| SA-WDA * | over 3 months | over 12 months | ||
| Total | -3.3 | 20.3 | 16.3 | |
| Industry | BE | -1.9 | 18.3 | 11.9 |
| Of which Manufacturing | C | -5.7 | 19.3 | 14.5 |
| Construction | FZ | -4.0 | 12.9 | 9.4 |
| Wholesale and retail trade, Transport, Accommodation and Food and beverage activities | GI | -3.6 | 28.6 | 19.6 |
| Trade | G | -2.7 | 11.1 | 11.3 |
| Transportation and storage | H | -4.5 | 86.2 | 51.5 |
| Accommodation and food service activities | I | -4.2 | 13.6 | 5.7 |
| Information and communication | JZ | -4.9 | 16.3 | 16.4 |
| Financial and insurance activities | KZ | -4.9 | 10.1 | 5.8 |
| Real estate activities | LZ | -6.4 | 18.4 | 21.9 |
| Business support activities | MN | -1.1 | 20.0 | 19.7 |
| Public administration and defence, education, human health and social work activities | OQ | -6.2 | 9.0 | 7.4 |
| Other services activities | RS | -1.8 | 22.5 | 20.5 |
- * Seasonally and working-day adjusted data
- ** Total of business start-ups during the last 3 or 12 months compared with the same months a year earlier
- Source: INSEE, REE (Sirene)
Documentation
Note méthodologique_anglaise_ Février 2018 (pdf,29 Ko)
Pour en savoir plus
Time series : Business demography
