


 13 July 2018
2018- n° 184Slight downturn in business start-ups in June 2018 Enterprise births - June 2018
13 July 2018
2018- n° 184Slight downturn in business start-ups in June 2018 Enterprise births - June 2018
In June 2018, the number of business births for all entreprises fell back slightly (−0.6% after +6.2% in May, seasonally and working-day adjusted). Conventional businesses start-ups shrunk (−1.3% after +6.8%) and micro-entrepreneurs' registrations went up slightly (+0.3% after +5.5%).
In June 2018, the number of business births for all entreprises fell back slightly (−0.6% after +6.2% in May, seasonally and working-day adjusted). Conventional businesses start-ups shrunk (−1.3% after +6.8%) and micro-entrepreneurs' registrations went up slightly (+0.3% after +5.5%).
graphiqueGraph1 – Monthly business start-ups (SA-WDA *)
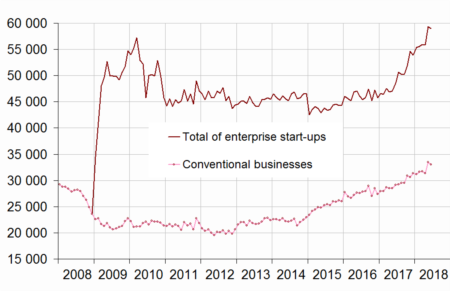
- * Seasonally and working-day adjusted data
- Source: INSEE, REE (Sirene)
tableauTable1 – Business set-ups by month (SA-WDA *)
| March 2018 | April 2018 | May 2018 | June 2018 | |
|---|---|---|---|---|
| Total businesses set-ups | 55,934 | 55,876 | 59,357 | 58,995 |
| Variation [m-o-m] % | 0.6 | -0.1 | 6.2 | -0.6 |
| Conventional businesses | 31,717 | 31,327 | 33,462 | 33,031 |
| Variation [m-o-m] % | 0.4 | -1.2 | 6.8 | -1.3 |
| Self-managed micro-entrepreneurs | 24,218 | 24,549 | 25,895 | 25,964 |
| Variation [m-o-m] % | 0.9 | 1.4 | 5.5 | 0.3 |
- * Seasonally and working-day adjusted data
- Source: INSEE, REE (Sirene)
+15.6% over the twelve last months
The raw number of business start-ups totted up during the last twelve months kept accelerating (+15.6% after +13.9% in May and +12.4% in April). All the types of business start-ups increased: micro-entrepreneurs' registrations (+24.8%), conventional sole proprietorship start-ups (+19.3%) and, to a lesser extent, company births (+2.4%).
Upsurge of business setp-ups in transportation and storage over the three last months
The raw number of business start-ups totted up during the last three months rose sharply (+21.2%). The sector “Transportation and storage” was the one that contributed the most to this rise (rise by +8,500 business start-ups, which comes to a contribution of 6.1 points)1. Within it, the increase was the higher in other activities of post and mail, which includes home-delivery (rise by +7,800 business start-ups).
More than two business set-ups out of five are self-managed micro-entrepreneurs' registrations
In June 2018, the share of micro–entrepreneurs' registrations in the businesses set up over the last twelve months increased for the eighth month in a row and reached 42.8%.
tableauTable0 – Business set-ups distribution by type
| April 2018 | May 2018 | June 2018 | |
|---|---|---|---|
| Companies | 31.5 | 31.0 | 30.6 |
| Sole proprietorships excluding self-managed micro-entrepreneurs | 26.3 | 26.4 | 26.6 |
| Self-managed micro-entrepreneurs | 42.2 | 42.5 | 42.8 |
- Source: INSEE, REE (Sirene)

1 The contribution of a sector to the overall variation is the variation observed in this sector, weighted by the share of this sector in the total number of births.
tableauTable2 – Cumulated business start-ups by type
| Moving total % change * | Moving total | Moving total | ||
|---|---|---|---|---|
| over 3 months | over 12 months | January- June 2018 | January- June 2017 | |
| Total | 21.2 | 15.6 | 354,879 | 298,729 |
| Companies | 0.6 | 2.4 | 104,367 | 104,325 |
| Conventional sole proprietorships | 29.9 | 19.3 | 97,914 | 77,238 |
| Self-managed micro-entrepreneurs | 34.3 | 24.8 | 152,598 | 117,166 |
- * Total of business start-ups during the last 3 or 12 months compared with the same months a year earlier
- Source: INSEE, REE (Sirene)
Revisions
The variation in the overall number of business births in May 2018 has been raised by 0.1 points to +6.2% due to the revision of raw data and the update of the SA-WDA parameters.
Business set-ups by economic activity
graphiqueGraph2 – Trade and business support activities monthly start-ups (SA-WDA *)
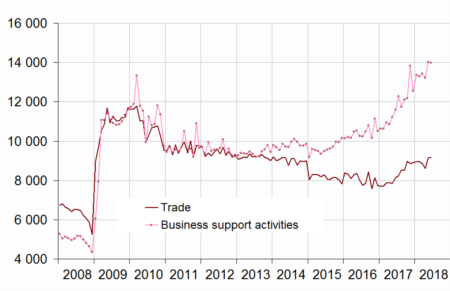
- * Seasonally and working-day adjusted data
- Source: INSEE, REE (Sirene)
graphiqueGraph3 – Construction and transportation business monthly set-ups (SA-WDA *)
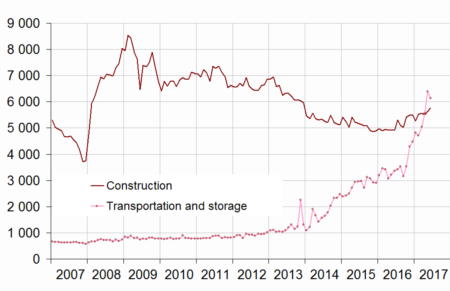
- * Seasonally and working-day adjusted data
- Source: INSEE, REE (Sirene)
tableauTable3 – Number of monthly business set-ups (incl. self-managed micro-entrepreneurs)
| NA | April 2018 | May 2018 | June 2018 | |
|---|---|---|---|---|
| Total | 55,876 | 59,357 | 58,995 | |
| Industry | BE | 2,336 | 2,425 | 2,467 |
| Of which Manufacturing | C | 2,083 | 2,186 | 2,212 |
| Construction | FZ | 5,514 | 5,629 | 5,765 |
| Wholesale and retail trade, Transport, Accommodation and Food and beverage activities | GI | 16,804 | 18,542 | 18,231 |
| Trade | G | 8,598 | 9,139 | 9,154 |
| Transportation and storage | H | 5,558 | 6,392 | 6,141 |
| Accommodation and food service activities | I | 2,649 | 3,011 | 2,936 |
| Information and communication | JZ | 2,831 | 2,886 | 2,929 |
| Financial and insurance activities | KZ | 1,374 | 1,502 | 1,489 |
| Real estate activities | LZ | 2,104 | 2,230 | 2,282 |
| Business support activities | MN | 13,222 | 14,027 | 13,988 |
| Public administration and defence, education, human health and social work activities | OQ | 6,514 | 6,793 | 6,486 |
| Other services activities | RS | 5,176 | 5,323 | 5,360 |
- * Seasonally and working-day adjusted data
- Source: INSEE, REE (Sirene)
tableauTable4 – Fluctuation in the number of business set-ups (incl. self-managed micro-entrepreneurs)
| NA | June 18 / May 18 | Moving total % change** | ||
|---|---|---|---|---|
| SA-WDA * | over 3 months | over 12 months | ||
| Total | -0.6 | 21.2 | 15.6 | |
| Industry | BE | 1.7 | 19.1 | 11.1 |
| Of which Manufacturing | C | 1.2 | 21.2 | 14.0 |
| Construction | FZ | 2.4 | 13.1 | 8.5 |
| Wholesale and retail trade, Transport, Accommodation and Food and beverage activities | GI | -1.7 | 28.1 | 18.1 |
| Trade | G | 0.2 | 10.6 | 10.8 |
| Transportation and storage | H | -3.9 | 88.3 | 46.8 |
| Accommodation and food service activities | I | -2.5 | 12.3 | 5.6 |
| Information and communication | JZ | 1.5 | 18.2 | 16.3 |
| Financial and insurance activities | KZ | -0.9 | 8.4 | 5.9 |
| Real estate activities | LZ | 2.3 | 19.9 | 22.9 |
| Business support activities | MN | -0.3 | 21.6 | 19.8 |
| Public administration and defence, education, human health and social work activities | OQ | -4.5 | 11.9 | 7.2 |
| Other services activities | RS | 0.7 | 23.9 | 19.5 |
- * Seasonally and working-day adjusted data
- ** Total of business start-ups during the last 3 or 12 months compared with the same months a year earlier
- Source: INSEE, REE (Sirene)
Documentation
Note méthodologique_anglaise_ Février 2018 (pdf,29 Ko)
Pour en savoir plus
Time series : Business demography
