


 13 March 2018
2018- n° 61In Q4 2017, payroll employment accelerated in all private sectors and continued to
decrease in public service Payroll employment - fourth quarter 2017
13 March 2018
2018- n° 61In Q4 2017, payroll employment accelerated in all private sectors and continued to
decrease in public service Payroll employment - fourth quarter 2017
In Q4 2017, net payroll job creation reached 72,700, that is an increase of +0.3% after an increase of +0.2% in the previous quarter. Payroll employment increased by 82,300 in the private sector while it decreased by 9,600 in the public sector because of the decline in the number of subsidised employment contracts. Year on year, it rose by 268,800 net jobs (+1.1%): 277,700 jobs were created in the private sector and 8,900 jobs were destroyed in the public service.
Payroll employment increased steadily in Q4 2017
In Q4 2017, net payroll job creation reached 72,700, that is an increase of +0.3% after an increase of +0.2% in the previous quarter. Payroll employment increased by 82,300 in the private sector while it decreased by 9,600 in the public sector because of the decline in the number of subsidised employment contracts. Year on year, it rose by 268,800 net jobs (+1.1%): 277,700 jobs were created in the private sector and 8,900 jobs were destroyed in the public service.
Payroll employment returned to growth in industry and accelerated in construction
In Q4 2017, payroll employment in industry rose by +6,400 (that is +0.2%, after 0.0%), its first increase since 2001. Year on year, the employment in industry is almost stable (that is +1,100).
Likewise, the employment recovery in construction seems to have been confirmed. It accelerated at the end of 2017: +13,200 (that is +1.0%), after +2,500 in the previous quarter. Year on year, the increase reached +30,100 jobs (that is +2.3%), that is the largest increase since 2007.
Payroll employment increased sharply again in market service, especially in temporary work
In Q4 2017, payroll employment increased by 59,700, that is +0.5%, after +0.4% in the previous quarter. Year on year, the market service sector as a whole supported the large majority of net jobs creations of payroll employment: +225,700, that is +1.9%.
Temporary employment continued to increase strongly in Q4 2017: it rose by 15,400 jobs i.e. +2.1% after +1.5% in Q3 2017. Over a year, it increased very sharply: +56,200, that is +8.2%. Employment in services excluding temporary work increased steadily again in Q4 2017: +44,300 jobs (i.e. +0.4 %, after +0.3%). Over a year, the market service sector excluding temporary work expanded by 169,500 jobs (+1.5%).
tableauTableau1 – Payroll employment change: thousands
| Change in 3 months | Change in 1 year | Level | ||
|---|---|---|---|---|
| 2017 | 2017 | 2017 | 2017 | |
| Q3 | Q4 | Q4 | Q4 | |
| Agriculture | 0.2 | 1,0 | 5,0 | 303.7 |
| Goods-producing industries excl. Construction | -0.3 | 6.4 | 1.1 | 3, 143.5 |
| of which : Manufacturing | 0.4 | 6.7 | 5.5 | 2, 778.2 |
| Construction | 2.5 | 13.2 | 30.1 | 1, 357.7 |
| Market services | 42.5 | 59.7 | 225.7 | 12, 212.2 |
| of which : Temporary employment (*) | 10.8 | 15.4 | 56.2 | 743.4 |
| Non-market services | -4.9 | -7.7 | 6.9 | 8, 055.9 |
| Total | 40.1 | 72.7 | 268.8 | 25, 073.0 |
| Private sector | 47.9 | 82.3 | 277.7 | 19, 281.9 |
| Public service | -7.9 | -9.6 | -8.9 | 5, 791.1 |
- How to read it: In Q4 2017, net job creation in market services amounted to 59, 700 jobs from the previous quarter
tableauTableau2 – Payroll employment change: percentage
| Change in 3 months | Change in 1 year | ||
|---|---|---|---|
| 2017 | 2017 | 2017 | |
| Q3 | Q4 | Q4 | |
| Agriculture | 0.1 | 0.3 | 1.7 |
| Goods-producing industries excl. Construction | 0.0 | 0.2 | 0,0 |
| of which : Manufacturing | 0.0 | 0.2 | 0.2 |
| Construction | 0.2 | 1,0 | 2.3 |
| Market services | 0.4 | 0.5 | 1.9 |
| of which : Temporary employment (*) | 1.5 | 2.1 | 8.2 |
| Non-market services | -0.1 | -0.1 | 0.1 |
| Total | 0.2 | 0.3 | 1.1 |
| Private sector | 0.3 | 0.4 | 1.5 |
| Public service | -0.1 | -0.2 | -0.2 |
- (*) Temporary workers are recorded in services, regardless of the sector in which they carry out their mission effectively.
- Scope: France excluding Mayotte
- Source: Acoss-Urssaf, Dares, INSEE
Employment slowed again in non-market services
Employment in mainly non-market services continued to decrease in Q4 2017: −7,700, after −4,900 in the previous quarter. This downturn was mainly due to the public service, (−9,600 jobs, after -7,900), because of the decline in the number of subsidised employment contracts. Over a year, mainly non-market services created 6,900 net jobs (that is +0.1%), of which 17,700 were in the private sector and −10 800 in public service.
Revisions
Compared to the employment estimate published on 12 December 2017, net job creation of Q3 2017 has been revised downwards by 4,400 mainly due to the revision in market services. Compared to the flash estimate focused on the private sector alone published on 13 February 2018, net job creation in Q4 2017 has been revised upwards by 29,000, each of the business sectors contributing to the revision. Finally, due to the integration of the definitive annual employment estimates for 2015, the increase in payroll employment in 2015 was reduced by 25,400, mainly in market services and construction.
graphiquegraphique – Variation in payroll employment in thousands
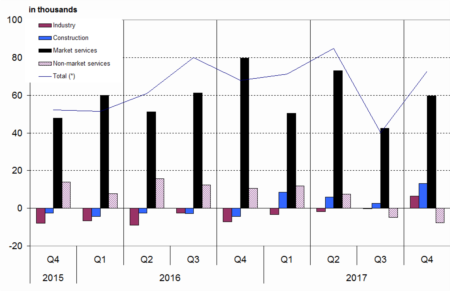
- Scope : France excluding Mayotte.
- Sources: Acoss-Urssaf, Dares, INSEE
tableauTableau3 – Payroll employment change
| Code | Change in | Change in | Niveau | ||
|---|---|---|---|---|---|
| 3 months | 1 year | ||||
| Naf | 2017 | 2017 | 2017 | 2017 | |
| rev.2 | Q3 | Q4 | Q4 | Q4 | |
| AZ | Agriculture | 0.2 | 1,0 | 5,0 | 303.7 |
| DE | Electricity, water supply, waste management | -0.7 | -0.3 | -4.4 | 365.3 |
| C1 | Manufacture of food products beverage | 0.5 | 2.2 | 6.6 | 576.4 |
| C2 | Manufacture of coke, and refined petroleum products | 0,0 | 0,0 | -0.2 | 9.3 |
| C3 | Manufacture of computer, electronic and electrical products; | 0.2 | 0.8 | -0.9 | 418.8 |
| C4 | Manufacture of transport equipment | -0.1 | 0.3 | -0.4 | 344.3 |
| C5 | Other manufacturing | 0,0 | 3.5 | 0.4 | 1, 429.4 |
| FZ | Construction | 2.5 | 13.2 | 30.1 | 1, 357.7 |
| GZ | Wholesale and retail trade | 6.2 | 7.1 | 25.9 | 3, 139.7 |
| HZ | Transportation and storage | –2,0 | 4,0 | 8.4 | 1, 384.1 |
| IZ | Accommodation and food service activities | 3,0 | 7.9 | 35.9 | 1, 080.8 |
| JZ | Information and communication | 5,0 | 7.7 | 22.2 | 765.5 |
| KZ | Financial and insurance activities | 1.1 | 1.2 | 3.1 | 875,0 |
| LZ | Real estate activities | -0.5 | 0.5 | -1.6 | 241.5 |
| MN | Professional, scientific and technical activities; | 30.9 | 36.5 | 134,0 | 3, 400.7 |
| of which : Temporary employment | 10.8 | 15.4 | 56.2 | 743.4 | |
| OQ | Public administration and defence | -4.9 | -7.7 | 6.9 | 8, 055.9 |
| RU | Other service activities | -1.1 | -5.2 | -2.1 | 1, 324.9 |
- Scope: France excluding Mayotte.
- Sources: Acoss-Urssaf, Dares, INSEE
tableauTableau4 – Revisions of payroll employment in Q3 2017 and Q4 2017
| Change in 3 months | ||||
|---|---|---|---|---|
| T3 2017 payroll employment | T4 2017 private scope only | |||
| new estimation | Rev. compare to 12/12/2017 | new estimation | Rev. compare to the Flash | |
| Agriculture | 0.2 | -0.5 | 1.0 | 0.5 |
| Goods-producing industries | -0.3 | 2.5 | 6.4 | 6.8 |
| Construction | 2.5 | 0.8 | 13.2 | 8.3 |
| Market services | 42.5 | -4.8 | 59.9 | 6.7 |
| of which: Temporary employment (*) | 10.8 | -0.1 | 15.4 | 7.3 |
| Non-market services | -4.9 | -2.5 | 1.7 | 6.7 |
| Total | 40.1 | -4.4 | 82.3 | 29.0 |
| Private sector | 47.9 | –2,0 | ||
| Public service | -7.9 | -2.5 | ||
- (*) Temporary workers are recorded in services, regardless of the sector in which they carry out their mission effectively.
- Scope: France excluding Mayotte
- Sources: Acoss-Urssaf, Dares, INSEE
Pour en savoir plus
