


Quarterly national accounts in Q2 2017 National accounts in base 2010 - Detailed figures
French GDP increased by 0.5% in Q2 2017 Quarterly national accounts - first estimate - second quarter 2017
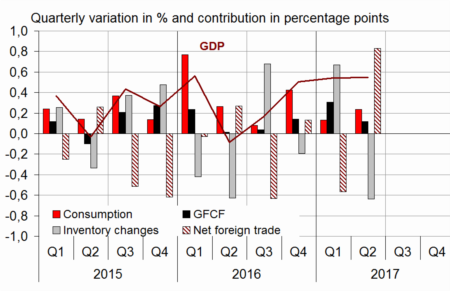
In Q2 2017, GDP in volume terms* kept on increasing: +0.5%, for the third quarter in a row. Households' consumption accelerated slightly (+0.3% after +0.1%) whereas total gross fixed capital formation (GFCF) decelerated markedly (+0.5% after +1.4%). All in all, final domestic demand excluding inventory changes contributed +0.4 points to GDP growth, as in the previous quarter.
Exports bounced back (+3.1% after −0.7%) while imports significantly slowed down (+0.2% after +1.2%). All in all, foreign trade balance contributed positively to GDP growth: +0.8 points after −0.6 points in the previous quarter. Conversely, changes in inventories contributed negatively (−0.6 points after +0.7 points).

* This growth rate is seasonally and working-day adjusted; volumes are chain-linked previous-year-prices volumes.
graphiqueGraph – GDP and its main components
- Source: INSEE
tableauTab1 – GDP and its main components: chain-linked volumes
| 2016 Q3 | 2016 Q4 | 2017 Q1 | 2017 Q2 | 2016 | 2017 (ovhg) | |
|---|---|---|---|---|---|---|
| GDP | 0.2 | 0.5 | 0.5 | 0.5 | 1.1 | 1.4 |
| Imports | 2.8 | 0.6 | 1.2 | 0.2 | 4.2 | 3.0 |
| Household consumption *expenditure | 0.0 | 0.7 | 0.1 | 0.3 | 2.1 | 0.9 |
| General government's *consumption expenditure | 0.3 | 0.3 | 0.3 | 0.4 | 1.2 | 1.1 |
| GFCF | 0.2 | 0.6 | 1.4 | 0.5 | 2.7 | 2.4 |
| *of which Non-financial corporated and unincorporated enterprises | 0.0 | 0.7 | 2.1 | 0.5 | 3.4 | 2.9 |
| Households | 1.0 | 1.1 | 1.2 | 1.0 | 2.4 | 3.5 |
| General government | -0.6 | -0.4 | -0.7 | -0.1 | -0.1 | -1.3 |
| Exports | 0.9 | 1.1 | -0.7 | 3.1 | 1.9 | 2.9 |
| Contributions : | ||||||
| Internal demand excluding inventory changes | 0.1 | 0.6 | 0.4 | 0.4 | 2.0 | 1.2 |
| Inventory changes | 0.7 | -0.2 | 0.7 | -0.6 | -0.1 | 0.3 |
| Net foreign trade | -0.6 | 0.1 | -0.6 | 0.8 | -0.8 | -0.1 |
- Source: INSEE
Total production increased slightly faster
Total production of goods and services accelerated slightly in Q2 2017 (+0.8% after +0.6%). It increased anew in goods (+1.0% after 0.0%) while it was a bit less dynamic than in the previous quarter in services (+0.7% after +0.8%).
Manufacturing output recovered (+0.9% after +0.0%), mainly due to the rebound in the coke and refined petroleum branch. Electricity and gas production increased anew. In the construction branch, production accelerated (+1.0% after +0.6%). Conversely, it slowed down very slightly in market services (+0.8% after +0.9%).
tableauTab2 – Production, consumption and GFCF: main components
| 2016 Q3 | 2016 Q4 | 2017 Q1 | 2017 Q2 | 2016 | 2017 (ovhg) | |
|---|---|---|---|---|---|---|
| Production of branches | 0.3 | 0.7 | 0.6 | 0.8 | 0.9 | 1.8 |
| Goods | 0.2 | 1.0 | 0.0 | 1.0 | 0.2 | 1.4 |
| Manufactured Industry | 0.8 | 0.7 | 0.0 | 0.9 | 0.8 | 1.4 |
| Construction | 0.2 | 0.9 | 0.6 | 1.0 | 0.1 | 2.1 |
| Market services | 0.4 | 0.7 | 0.9 | 0.8 | 1.4 | 2.1 |
| Non-market services | 0.2 | 0.2 | 0.3 | 0.4 | 1.0 | 0.9 |
| Household consumption | 0.0 | 0.7 | 0.1 | 0.3 | 2.1 | 0.9 |
| Food products | 0.7 | -0.2 | 0.4 | 0.6 | 0.9 | 1.0 |
| Energy | -1.3 | 3.4 | -3.2 | 0.5 | 2.2 | -0.7 |
| Engineered goods | -1.4 | 1.1 | 0.1 | 0.2 | 2.4 | 0.5 |
| Services | 0.4 | 0.4 | 0.6 | 0.2 | 1.6 | 1.3 |
| GFCF | 0.2 | 0.6 | 1.4 | 0.5 | 2.7 | 2.4 |
| Manufactured goods | -2.2 | 0.1 | 2.0 | -0.8 | 6.1 | 0.2 |
| Construction | -0.1 | 0.8 | 0.6 | 0.8 | 0.2 | 1.8 |
| Market services | 2.1 | 0.8 | 2.0 | 1.0 | 3.9 | 4.5 |
- Source: INSEE
Household consumption accelerated slightly
Household consumption expenditure accelerated slightly in Q2 2017 (+0.3% after +0.1%). Expenditure on goods bounced back (+0.4% after −0.4%) while it decelerated in services (+0.2% after +0.6%).
Expenditure on energy picked up (+0.5% after −3.2%). Consumption of engineered goods accelerated slightly (+0.2% after +0.1%), as well as consumption of food products (+0.6% after +0.4%).
GDP and its main components
Expenditure on services decelerated (+0.2 % after +0.6 %), notably on accommodation and catering.
tableauTab3 – Sectoral accounts
| 2016 Q3 | 2016 Q4 | 2017 Q1 | 2017 Q2 | 2016 | 2017 (ovhg) | |
|---|---|---|---|---|---|---|
| Profit ratio of NFCs* (level) | 31.6 | 31.7 | 31.6 | 31.8 | ||
| Households' purchasing power | 0.7 | 0.2 | 0.2 | 1.8 | 0.7 |
- *NFCs: non-financial corporations
- Source: INSEE
tableauTab4 – Households' disposable income and ratios of households' account
| 2016 Q3 | 2016 Q4 | 2017 Q1 | 2017 Q2 | 2016 | 2017 (ovhg) | |
|---|---|---|---|---|---|---|
| HDI | 0.8 | 0.5 | 0.8 | 1.7 | 1.6 | |
| Household purchasing power | 0.7 | 0.2 | 0.2 | 1.8 | 0.7 | |
| HDI by cu* (purchasing power) | 0.6 | 0.1 | 0.1 | 1.4 | 0.5 | |
| Adjusted HDI (purchasing power) | 0.7 | 0.2 | 0.2 | 1.7 | 0.8 | |
| Saving rate (level) | 14.4 | 14.0 | 14.0 | 14.0 | ||
| Financial saving rate (level) | 5.1 | 4.6 | 4.5 | 4.7 |
- *cu: consumption unit
- Source: INSEE
Corporate investment decelerated significantly
In Q2 2017, total GFCF decelerated sharply (+0.5% after +1.4%), especially that of enterprises (+0.5% after +2.1%). Investment of households remained sustained (+1.0% after +2.1%). Investment in construction accelerated slightly (+0.8% after +0.6%) thanks to a renewed vigour in civil engineering. Conversely investment in manufactured goods fell back markedly (−0.8% after +2.0%), notably due to a decline in equipment goods and, to a lesser extent, to a stronger decrease in transport equipment. GFCF in market services sharply decelerated (+1.0% after +2.0%), mainly owing to a downturn in corporate services.
tableauTab5 – Ratios of non-financial corporations' account
| 2016 Q3 | 2016 Q4 | 2017 Q1 | 2017 Q2 | 2016 | |
|---|---|---|---|---|---|
| Profit share | 31.6 | 31.7 | 31.6 | 31.8 | |
| Investment ratio | 23.3 | 23.4 | 23.7 | 23.3 | |
| Savings ratio | 19.5 | 19.6 | 20.0 | 19.7 | |
| Self-financing ratio | 83.4 | 84.1 | 84.3 | 84.2 |
- Source: INSEE
Foreign trade balance contributed positively to GDP growth
Exports bounced back in Q2 2017 (+3.1% after −0.7%), especially in transport equipment and “other manufactured goods”. At the same time, imports significantly decelerated (+0.2% after +1.2%): in particular, purchases of refined petroleum products decreased, so did those in transport equipment. All in all, foreign trade balance contributed positively to GDP growth this quarter: +0.8 points (after −0.6 points).
Changes in inventories slowed down
In Q2 2017, the contribution of changes in inventories to GDP growth amounted to −0.6 points (after +0.7 points in the beginning of 2017). In particular, they decreased steeply in transport equipment.
tableauTab6 – Expenditure, receipts and net borrowing of public administrations
| 2016 Q3 | 2016 Q4 | 2017 Q1 | 2017 Q2 | 2016 | |
|---|---|---|---|---|---|
| In billions of euros | |||||
| Total expenditure | 315.3 | 315.1 | 317.4 | 1257.0 | |
| Total receipts | 294.8 | 297.1 | 298.7 | 1181.2 | |
| Net lending (+) or borrowing (-) | -20.4 | -18.1 | -18.7 | -75.8 | |
| In % of GDP | |||||
| Net lending (+) or borrowing (-) | -3.7 | -3.2 | -3.3 | -3.4 |
- Source: INSEE
The GDP profile has been revised over the past
GDP growth estimate in Q1 2017 is confirmed: +0.5%. Revisions about different aggregates make up for one another; they are mainly due to the revision of indicators.
Avertissement
Quarterly national accounts
Quarterly debt of the general government
Sources
Quarterly national accounts
Quarterly accounts are a consistent set of indicators which provides a global overview of recent economic activity.
Time series of the main aggregates of quarterly national accounts can be accessed through the "Summary". They are classified into eight categories:
- Gross domestic product (GDP) and main economic aggregates ;
- Goods and services ;
- Households' consumption ;
- Foreign trade ;
- Activities ;
- Institutional sectors ;
- Households' income and purchasing power ;
- Public finances.
For each category, are available :
- synthetic files displaying from the accounts the relevant information for economic analysis ,
- sometimes, one or two files displaying all the data available.
Documentation
Abbreviated methodology (pdf, 140 Ko )
Methodology - First estimate at 30 days (pdf, 112 Ko )