


 16 May 2017
2017- n° 127Downturn in business start-ups in April 2017 Enterprise births - April 2017
16 May 2017
2017- n° 127Downturn in business start-ups in April 2017 Enterprise births - April 2017
In April 2017, the number of business births for all entreprises fell back (−1.7% after +2.3% in March, seasonally and working-day adjusted). This was mostly due to micro-entrepreneurs' registrations (−3.6%) and at a lessser extent to start-ups excluding self-managed micro-entrepreneurs (−0.4%).
In April 2017, the number of business births for all entreprises fell back (−1.7% after +2.3% in March, seasonally and working-day adjusted). This was mostly due to micro-entrepreneurs' registrations (−3.6%) and at a lessser extent to start-ups excluding self-managed micro-entrepreneurs (−0.4%).
graphiqueGraph1 – Business start-ups (sa-wda *)
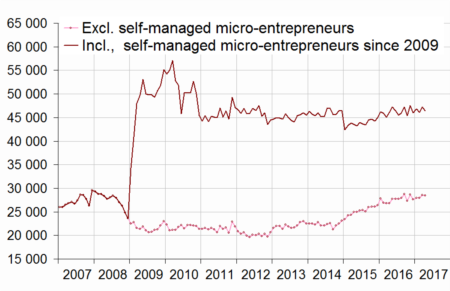
- * Seasonally and working-day adjusted data
- Source: INSEE (Sirene)
tableauTable1 – Business set-ups by month (sa-wda *)
| Jan. 2017 | Feb. 2017 | March 2017 | April 2017 | |
|---|---|---|---|---|
| Excl. self-managed micro-entrepreneurs | 27,928 | 27,953 | 28,577 | 28,449 |
| Variation [m-o-m] % | 1.1 | 0.1 | 2.2 | -0.4 |
| Incl. self-managed micro-entrepreneurs | 46,791 | 46,135 | 47,205 | 46,399 |
| Variation [m-o-m] % | 1.7 | -1.4 | 2.3 | -1.7 |
- * Seasonally and working-day adjusted data
- Source: INSEE (Sirene)
Stability year on year (three months basis)
Compared to the same period one year before, the raw amount of births added up in the last three months was stable in April (after +6.2% in raw data). Micro-entrepreneurs' registrations slipped back (−4.3%) while other types of enterprise start-ups kept rising: companies by +3.2% and sole proprietorship start-ups excluding micro-entrepreneurs by +2.4%. The higher growth in business start-ups was recorded in the transportation sector and the higher drop in trade.
tableauTable2 – Business start-ups by type
| Moving total % change * | Moving total | Moving total | ||
|---|---|---|---|---|
| over 3 months | over 12 months | January- April 2017 | January- April 2016 | |
| Total | 0.0 | 4.6 | 203,455 | 198,271 |
| Companies | 3.2 | 7.2 | 71,013 | 67,537 |
| Sole proprietorships (SP) | –1.7 | 3.3 | 132,442 | 130,734 |
| SP excluding self-managed micro-entrepreneurs | 2.4 | 7.7 | 52,946 | 50,843 |
| Self-managed micro-entrepreneurs | -4.3 | 0.7 | 79,496 | 79,891 |
- * Total of business start-ups during the last 3 or 12 months compared with the same months a year earlier
- Source: INSEE (Sirene)
+4.6% year on year (twelve months basis)
The raw number of business start-ups totted up during the last twelve months kept advancing sharply (+4.6% year on year after +5.8%). This rise was mainly a result of sole proprietorship start-ups excluding self-managed micro-entrepreneurs (+7.7%) and company births (+7.2%). As for micro-entrepreneurs' registrations, they slightly rose (+0.7%).
A little less than two business set-ups out of five are self-managed micro-entrepreneurs' registrations
In April 2017, the share of micro–entrepreneurs' registrations in the businesses set up over the twelve last months amounted to 39.8%. One year before, it was 41.3%.
tableauTable0 – Business set-ups distribution by type
| Feb. 2017 | March 2017 | April 2017 | |
|---|---|---|---|
| Companies | 34.1 | 34.3 | 34.4 |
| Sole proprietorships excluding self-managed micro-entrepreneurs | 25.7 | 25.8 | 25.8 |
| Self-managed micro-entrepreneurs | 40.2 | 40.0 | 39.8 |
- Source: INSEE (Sirene)
Revisions
The variation in the overall number of business births in March 2017 has been lowered by 0.1 points to +2.3% due to the revision of raw data and the update of the SA-WDA parameters.
Business set-ups by economic activity
graphiqueGraph2 – Trade and business support activities start-ups (sa-wda *)
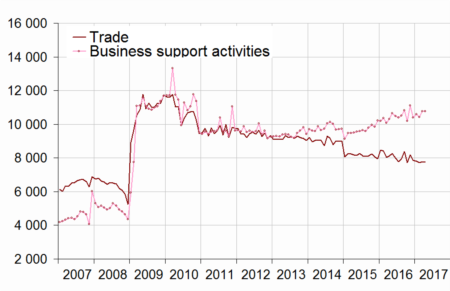
- * Seasonally and working-day adjusted data
- Source: INSEE (Sirene)
graphiqueGraph3 – Construction and transportation business set-ups (sa-wda *)
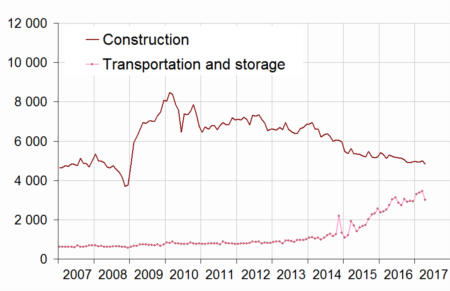
- * Seasonally and working-day adjusted data
- Source: INSEE (Sirene)
tableauTable3 – Number of business set-ups (incl. self-managed micro-enterprises)
| NA | Feb. 2017 | March 2017 | April 2017 | |
|---|---|---|---|---|
| Total | 46,135 | 47,205 | 46,399 | |
| Industry | BE | 2,066 | 2,024 | 1,969 |
| Of which Manufacturing | C | 1,756 | 1,761 | 1,710 |
| Construction | FZ | 4,929 | 4,994 | 4,838 |
| Wholesale and retail trade, Transport, Accommodation and Food and beverage activities | GI | 13,667 | 13,818 | 13,362 |
| Trade | G | 7,720 | 7,784 | 7,763 |
| Transportation and storage | H | 3,384 | 3,451 | 3,013 |
| Accommodation and food service activities | I | 2,563 | 2,583 | 2,586 |
| Information and communication | JZ | 2,348 | 2,385 | 2,308 |
| Financial and insurance activities | KZ | 1,381 | 1,374 | 1,370 |
| Real estate activities | LZ | 1,573 | 1,750 | 1,833 |
| Business support activities | MN | 10,429 | 10,761 | 10,758 |
| Public administration and defence, education, human health and social work activities | OQ | 5,905 | 5,988 | 5,888 |
| Other services activities | RS | 3,838 | 4,110 | 4,074 |
- * Seasonally and working-day adjusted data
- Source: INSEE (Sirene)
tableauTable4 – Fluctuation in the number of business set-ups (incl. self-managed micro-entrepreneurs)
| NA | April 17 / March 17 | Moving total % change** | ||
|---|---|---|---|---|
| sa-wda * | over 3 months | over 12 months | ||
| Total | -1.7 | 0.0 | 4.6 | |
| Industry | BE | -2.7 | -2.7 | 2.0 |
| Of which Manufacturing | C | -2.9 | -5.2 | 0.2 |
| Construction | FZ | -3.1 | -7.0 | -4.1 |
| Wholesale and retail trade, Transport, Accommodation and Food and beverage activities | GI | -3.3 | 0.7 | 6.9 |
| Trade | G | -0.3 | -6.8 | -2.6 |
| Transportation and storage | H | -12.7 | 27.0 | 42.4 |
| Accommodation and food service activities | I | 0.1 | -0.2 | 7.1 |
| Information and communication | JZ | -3.2 | -0.2 | 6.7 |
| Financial and insurance activities | KZ | -0.3 | 1.2 | 2.4 |
| Real estate activities | LZ | 4.7 | 9.2 | 9.3 |
| Business support activities | MN | 0.0 | 2.4 | 7.5 |
| Public administration and defence, education, human health and social work activities | OQ | -1.7 | 2.4 | 5.5 |
| Other services activities | RS | -0.9 | -3.7 | -0.2 |
- * Seasonally and working-day adjusted data
- ** Total of business start-ups during the last 3 or 12 months compared with the same months a year earlier
- Source: INSEE (Sirene)
Pour en savoir plus
Time series : Business demography
