


 31 March 2017
2017- n° 91In January 2017, services output rose sharply (+1.1%) Index of services production - January 2017
31 March 2017
2017- n° 91In January 2017, services output rose sharply (+1.1%) Index of services production - January 2017
In January 2017, output grew in services (+1.1%) after a slight drop in December (−0.2%).

All series are seasonnally (SA) and working-day adjusted (WDA).
The commentary shows variations of subsections by decreasing contribution. The contribution of a subsection depends on the extent of the change and on its weight.
In January 2017, output grew in services (+1.1%) after a slight drop in December (−0.2%).
Services output rose over the last three months
Over the past three months, services production increased by 1.5% compared to the previous three months.
It rose sharply in real estate activities (+4.3%). It also grew in business support activities (+1.2%), particularly in administrative and business service activities (+1.9%). It rose markedly in transportation and storage (+2.4%) and household services (+3.2%) and more moderatly in accomodation and food service activities (+0.7%). By contrast, it declined slightly in information and communication (−0.2%).
It grew markedly over a year
In services, output of the last three months rose sharply year on year (+3.5%).
Over the same period, it went up in all sectors. It increased significantly in business support (+4.0%), notably in administrative and business service activities (+6.3%). It rose sharply in real estate activities (+3.8%), information and communication (+2.7%), transportation and storage (+2.9%), household services (+4.9%) and food and beverage service activities (+2.7%)
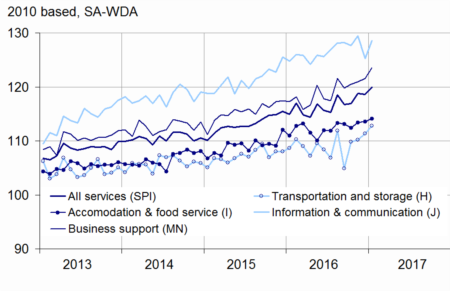
graphiqueGraph1 – Index of services production
tableauTable1 – Variation in the services production
| Change in % | |||||
|---|---|---|---|---|---|
| Weight * | Jan./ Dec. | Dec./ Nov. | q-o-q (1) | y-o-y (2) | |
| Index of services production | 10000 | 1.1 | −0.2 | 1.5 | 3.5 |
| H Transportation and storage | 1601 | 1.2 | 1.1 | 2.4 | 2.9 |
| I Accomodation and food service activities | 926 | 0.4 | 0.1 | 0.7 | 2.7 |
| J Information and communication | 1745 | 2.6 | −3.2 | −0.2 | 2.7 |
| L Real estate activities | 1064 | −3.4 | 0.6 | 4.3 | 3.8 |
| M+N Business support | 4020 | 1.7 | 0.5 | 1.2 | 4.0 |
| M Specialised, scientific and technical activities | 2210 | 2.5 | 0.6 | 0.6 | 2.1 |
| N Administrative and business service activities | 1810 | 0.7 | 0.3 | 1.9 | 6.3 |
| R+S Household ervices | 644 | 1.0 | 0.3 | 3.2 | 4.9 |
- *Weight (10 000 = H…S excepting K, O, P, Q)
- (1) Quarter-on-quarter: last three months / previous three months
- (2) Year-on-year: last three months / same three months of previous year
- Source: INSEE Acceleration in business support
In January 2017, output in business support activities gathered pace markedly (+1.7% after +0.5% in December).
It rose strongly in specialised, scientific and technical activities (+2.5% after +0.6% in December), particularly in architecture and engineering activities (+4.6%) and legal and accounting activities (+3.6%). By contrast, it plummeted in other specialised, scientific and technical activities (−6.9%).
Output grew again in administrative and business support activities (+0.7% after +0.3%). It bounced back sharply in employment activities (+4.3%) and travel agency and tour operators (+5.1%). However, it shrank in rental and leasing activities (−1.3%) and other administrative and business support activities (−1.0%).
Sharp rebound in information and communication
In January, output in information and communication recovered markedly (+2.6%) after a significant downturn in December (−3.2%). It picked up strongly in telecommunications (+6.4% after −6.6%). It bounced back in computer programming (+1.7%) and information services (+4.3%). By contrast, it declined again in publishing activities (−1.1%) and decreased in motion picture production, sound recording and music publishing activities (−4.4%).
Further increase in transportation and storage
Output in transportation and storage grew again in Januray (+1.2% after +1.1% in December). In particular, it rose in land transport (+2.3%), warehousing and support for transportation (+0.9%) and in air transport (+1.8% after −2.9%). By contrast, it shrank in water transport (−3.5% after +12.9%).
Slight rise in accomodation and food service activities
In January, output grew slightly in accomodation and food service activities (+0.4% after +0.1% in December). It accelerated slightly in food and beverage service activities (+0.5% after +0.2%) and recovered in accomodation (+0.3% after −0.1%).
Marked fall in real estate activities
Output in real estate activities went down sharply in January (−3.4%) after a slight rise in December (+0.6%).
tableauTable2 – Variation in services production
| Changes in % | |||||
|---|---|---|---|---|---|
| Weight * | Jan. 2017 | Jan./ Dec. | Dec./ Nov. | q-o-q (1) | |
| Index of services production | 10000 | 120.0 | 1.1 | −0.2 | 1.5 |
| H transportation and storage | 1601 | 112.8 | 1.2 | 1.1 | 2.4 |
| 49 Land transport… | 686 | 116.4 | 2.3 | 0.0 | 0.8 |
| 50 Water transport | 63 | 175.7 | −3.5 | 12.9 | 15.2 |
| 51 Air transport | 129 | 105.4 | 1.8 | −2.9 | 4.5 |
| 52 Warehousing and support for transportation | 563 | 112.6 | 0.9 | 1.9 | 2.1 |
| 53 Postal and courier activities | 161 | 79.1 | 0.4 | −1.5 | 1.9 |
| I Accomodation and food service activities | 926 | 114.1 | 0.4 | 0.1 | 0.7 |
| 55 Accomodation | 211 | 106.0 | 0.3 | −0.1 | 2.2 |
| 56 Food and beverage service activities | 715 | 116.5 | 0.5 | 0.2 | 0.3 |
| J Information-communication | 1745 | 128.6 | 2.6 | −3.2 | −0.2 |
| 58 Publishing activities | 220 | 99.1 | −1.1 | −2.7 | 0.4 |
| 59 Motion picture, sound recording, music publishing | 124 | 111.8 | −4.4 | 0.1 | 1.1 |
| 60 Programming and broadcasting activities | 68 | 127.8 | −0.1 | 2.6 | 4.1 |
| 61 Telecommunications | 558 | 134.2 | 6.4 | −6.6 | −3.3 |
| 62 Computer programming... | 683 | 134.1 | 1.7 | −1.7 | 1.4 |
| 63 Information services | 92 | 147.2 | 4.3 | −3.2 | 2.2 |
| L Real estate activities | 1064 | 108.3 | −3.4 | 0.6 | 4.3 |
| M Specialised, scientific and technical activities | 2210 | 120.7 | 2.5 | 0.6 | 0.6 |
| 69 Legal and accounting activities | 496 | 119.9 | 3.6 | −1.1 | 1.9 |
| 70 Activities of head offices and management consultancy | 665 | 123.5 | 1.8 | 0.4 | 1.6 |
| 71 Architecture and engineering activities | 465 | 127.2 | 4.6 | 4.8 | 2.0 |
| 72 Scientific research and development | 313 | 102.0 | 2.2 | 2.0 | −4.8 |
| 73 Advertising and market research | 171 | 114.8 | 3.1 | −4.8 | 0.5 |
| 74 Other professional, scientific and technical activities | 71 | 154.5 | −6.9 | −1.7 | −3.4 |
| 75 Veterinary activities | 29 | 124.5 | 0.0 | −1.6 | −0.9 |
| N Adminsitrative and business service activities | 1810 | 127.1 | 0.7 | 0.3 | 1.9 |
| 77 Rental and lelasing activities | 545 | 124.8 | −1.3 | 0.4 | 1.7 |
| 78 Employment activities | 512 | 133.4 | 4.3 | −0.4 | 2.6 |
| 79 Travel agency, tour operator | 45 | 117.8 | 5.1 | −2.8 | 2.9 |
| 80 Security and investigation | 109 | 125.3 | 1.0 | −1.4 | 0.6 |
| 81 Services to building and landscape anctivities | 248 | 121.4 | −0.8 | 2.5 | 0.8 |
| 82 Other administrative and business support activities | 351 | 127.1 | −1.0 | 0.6 | 2.0 |
| R Arts, entertainment and recreation | 306 | 128.5 | 1.6 | 0.8 | 4.4 |
| S Other personal services | 338 | 111.5 | 0.4 | −0.2 | 2.0 |
- *Weight (10 000 = H…S excepting K, O, P, Q)
- (1) Quarter-on-quarter: last three months / previous three months
- Source: INSEE
Documentation
Pour en savoir plus
