


 9 March 2017
2017- n° 62The employment continued to increase in Q4 2016, buoyed by temporary work Payroll employment - fourth quarter 2016
9 March 2017
2017- n° 62The employment continued to increase in Q4 2016, buoyed by temporary work Payroll employment - fourth quarter 2016
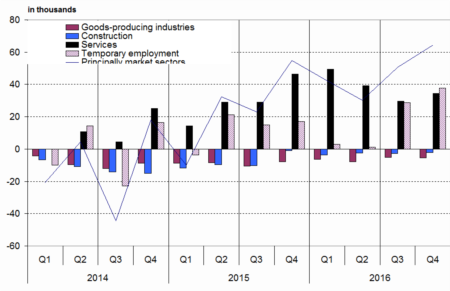
In Q4 2016, payroll employment in the non-farm market sectors continued to increase (+64,400 jobs, that is 0.4%, after +50,500 jobs in the previous quarter). This is the seventh consecutive quarter of rise. The slight speeding up in Q4 2016 is primarily due to temporary employment (+37,600 jobs, i.e. +6.1%, after +28,600 jobs). Year-on-year, the principally market sectors created 187,200 net jobs (+1.2%).

Warnings: From the next issue related to Q1 2017 (to be released on 13/06/2017), the publication will be produced in partnership with Acoss and Dares (see supplementary sheet included in the documentation of the indicator). Its scope will be extended to all employees and will cover the overseas departments (excluding Mayotte).
The introduction of the “Déclaration Sociale Nominative” (DSN) to replace the “bordereau récapitulatif de cotisations” (BRC) may affect transitorily the declarative behavior of businesses. During the ramp-up phase of the DSN, adjustments are made in the statistical processing chain of employment estimates to reflect these changes. These changes are likely to generate more revisions than usual to data.
Payroll employment speeded up slightly in the market sector
In Q4 2016, payroll employment in the non-farm market sectors continued to increase (+64,400 jobs, that is 0.4%, after +50,500 jobs in the previous quarter). This is the seventh consecutive quarter of rise. The slight speeding up in Q4 2016 is primarily due to temporary employment (+37,600 jobs, i.e. +6.1%, after +28,600 jobs). Year-on-year, the principally market sectors created 187,200 net jobs (+1.2%).
Once again, industry and construction destroyed more jobs tha they created
In Q4 2016, employment continued to decrease in industry and construction, at a similar pace to that in the previous quarter: 5,500 jobs were destroyed in industry (that is −0.2%) and 2,200 jobs were destroyed in construction (that is −0.2%). Year on year, industry lost 24,900 jobs (−0.8%) whereas construction shed 10,800 jobs (−0.8%).
Jobs in services benefited from the sharp rise in temporary employment again
Temporary work continued to increase strongly in Q4 2016 (+37,600 jobs, i.e. +6.1 %). At the same time, employment in services excluding temporary work rose at the same pace as in the previous quarter (+34,500 jobs, i.e. 0.3 %, after +29,600). Overall, the employment in the market service sector increased steadily compared to Q3 2016 (+72,100 jobs, that is +0.6%, after +58,200). Year on year, temporary employment increased steeply (+70,200 jobs, i.e. +12.0%) and the market service sector as a whole expanded by 222,900 jobs (+1.9%).
tableauTable1 – Payroll employment change in the competitive sector : thousands
| Change in 3 months | Change in 1 year | Level | ||
|---|---|---|---|---|
| 2016 | 2016 | 2016 | 2016 | |
| Q3 | Q4 | Q4 | Q4 | |
| Principally market sectors | 50.5 | 64.4 | 187.2 | 1, 6174.9 |
| Goods-producing industries excl. Construction | -5.1 | -5.5 | -24.9 | 3, 103.9 |
| Manufacturing | -3.4 | -4,0 | -18.8 | 2, 742.4 |
| Construction | -2.6 | -2.2 | -10.8 | 1, 305.9 |
| Services | 58.2 | 72.1 | 222.9 | 11, 765.2 |
| of which : Temporary employment (**) | 28.6 | 37.6 | 70.2 | 653.2 |
| Principally non-market sectors (*) | 5.8 | 5.1 | 26.7 | 2, 044.4 |
| Total competitive sector (*) | 56.3 | 69.5 | 213.9 | 18, 219.4 |
- How to read it: In Q4 2016, net job creation in services amonted to 72,100 jobs from the previous quarter.
tableauTable2 – Payroll employment change in the competitive sector : percentage
| Change in 3 months | Change in 1 year | ||
|---|---|---|---|
| 2016 | 2016 | 2016 | |
| Q3 | Q4 | Q4 | |
| Principally market sectors | 0.3 | 0.4 | 1.2 |
| Goods-producing industries excl. Construction | -0.2 | -0.2 | -0.8 |
| Manufacturing | -0.1 | -0.1 | -0.7 |
| Construction | -0.2 | -0.2 | -0.8 |
| Services | 0.5 | 0.6 | 1.9 |
| of which : Temporary employment (**) | 4.9 | 6.1 | 12,0 |
| Principally non-market sectors (*) | 0.3 | 0.3 | 1.3 |
| Total competitive sector (*) | 0.3 | 0.4 | 1.2 |
- (*) Excl. Agriculture and public employees in non-markets sectors (administration, health, education and social activity) , in metropolitan France
- (**) Temporary workers are recorded in services, regardless of the sector in which they carry out their mission effectively.
- Source: INSEE
tableauTable3 – Payroll employment change in the competitive sector (*)
| Code | Change in 3 months | Change in 1 year | Level | ||
|---|---|---|---|---|---|
| Naf | 2016 | 2016 | 2016 | 2016 | |
| rev.2 | Q3 | Q4 | Q4 | Q4 | |
| DE | Electricity, gas, steam, and air conditioning supply ; water supply, sewerage, waste management and remediation activities | -1.8 | -1.5 | -6.1 | 361.5 |
| C1 | Manufacture of food products beverage and tobacco products | 0.2 | 0.6 | 3.7 | 554,0 |
| C2 | Manufacture of coke, and refined petroleum products | 0,0 | 0,0 | 0,0 | 9.3 |
| C3 | Manufacture of computer, electronic and electrical products; manufacture of machinery and equipment | -1,0 | -1.6 | -8.7 | 416.7 |
| C4 | Manufacture of transport equipment | -0.4 | -0.9 | -3.8 | 344.7 |
| C5 | Other manufacturing | -2.1 | -2.2 | -10,0 | 1, 417.7 |
| FZ | Construction | -2.6 | -2.2 | -10.8 | 1, 305.9 |
| GZ | Wholesale and retail trade ; repair of motor vehicles and motorcycles | 3.3 | 5.3 | 19.9 | 3, 051.7 |
| HZ | Transportation and storage | -0.3 | -0.5 | 11.2 | 1, 353.2 |
| IZ | Accommodation and food service activities | 2.1 | 6.3 | 21.4 | 1, 033.3 |
| JZ | Information and communication | 6.6 | 5.1 | 22,0 | 735.4 |
| KZ | Financial and insurance activities | -0.6 | 4.2 | 8.8 | 858.5 |
| LZ | Real estate activities | 0.2 | -0.6 | 1.7 | 236.9 |
| MN | Professional, scientific and technical activities; administrative and support service activities | 41.6 | 48.7 | 121.6 | 3, 196.1 |
| of which : Temporary employment | 28.6 | 37.6 | 70.2 | 653.2 | |
| OQ | Public administration and defence ; compulsory social security; education; human health and social work activities | 5.8 | 5.1 | 26.7 | 2, 044.4 |
| RU | Other service activities | 5.4 | 3.6 | 16.3 | 1, 300.1 |
- (*) Excl. agriculture and public employees in non-markets sectors (administration, health, education and social activity) , in metropolitan France
- Source: INSEE
graphiqueGraph1 – Variation in employment in the principally market sectors
Revisions
Compared with the release of 10 February 2017, the estimated net job creation in principally market sectors in Q3 and Q4 2016 is virtually unchanged (−1,900 and +2,200 respectively).
Pour en savoir plus
