


 23 February 2016
2016- n° 17In February 2016, the economic climate does not improve in the building construction
industry Monthly survey of building - February 2016
23 February 2016
2016- n° 17In February 2016, the economic climate does not improve in the building construction
industry Monthly survey of building - February 2016
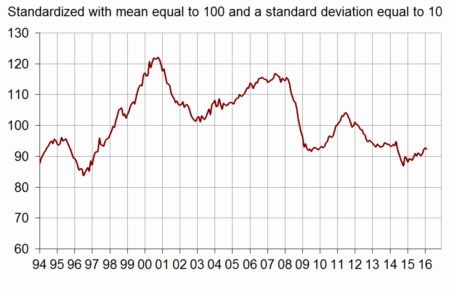
According to the business managers surveyed in February 2016, the business climate remains deteriorated in the building construction industry. The composite indicator is almost unchanged and is significantly below (92) its long-term average (100).
According to the business managers surveyed in February 2016, the business climate remains deteriorated in the building construction industry. The composite indicator is almost unchanged and is significantly below (92) its long-term average (100).
graphiqueClimate – Business climate composite indicator
graphiqueTurningPoint – Turning-point indicator
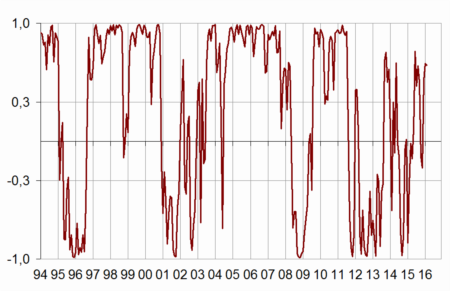
- Note: close to 1 (respectively –1), it indicates a favourable business climate (respectively unfavourable).
The turning point indicator remains in the favourable zone.
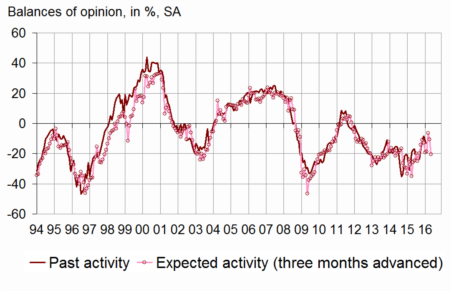
Business managers are more pessimistic about their expected activity
In February 2016, more business manager than in January indicate a fall of their activity for the next few months. The balances of opinion on past activity is virtually stable. Both balances on past and expected activity are below their long-term average.
graphiqueActivity – Activity tendency in building construction
tableauTableau1 – Building industry economic outlook
| Mean* | Nov. 15 | Dec. 15 | Jan. 16 | Feb. 16 | |
|---|---|---|---|---|---|
| Composite indicator | 100 | 91 | 92 | 93 | 92 |
| Past activity | –4 | –11 | –8 | –12 | –13 |
| Expected activity | –7 | –19 | –6 | –10 | –21 |
| Gen. business outlook | –19 | –21 | |||
| Past employment | –5 | –30 | –28 | –25 | –24 |
| Expected employment | –4 | –24 | –23 | –20 | –23 |
| Opinion on order books | –23 | –49 | –51 | –46 | –45 |
| Order books (in month) | 5,4 | 6,4 | 6,4 | 6,4 | 6,5 |
| Production capacity utilisation rate | 88,5 | 84,9 | 84,6 | 85,1 | 85,2 |
| Obstacles to production increase (in %) | 32 | 20 | 20 | 19 | 21 |
| - Because of workforce shortage (in %) | 14,4 | 2,8 | 3,1 | 2,9 | 3,2 |
| Recruiting problems (in %) | 58 | 43 | |||
| Expected prices | –15 | –30 | –30 | –28 | –30 |
| Cash-flow position | –10 | –21 | |||
| Repayment period | 29 | 40 |
- * Mean since September 1993.
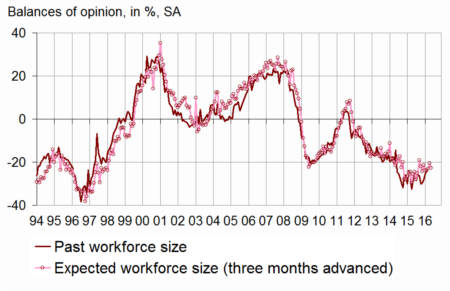
Persistent pessimism about employment
In February 2016, almost as many business managers as in January indicate a fall in their staff size during the three last months. Concerning expected employement, the balance of opinion has slightly decreased. The two balances of opinion stand at a level far below its long-term average.
graphiqueWorkforce – Workforce size tendency in building construction
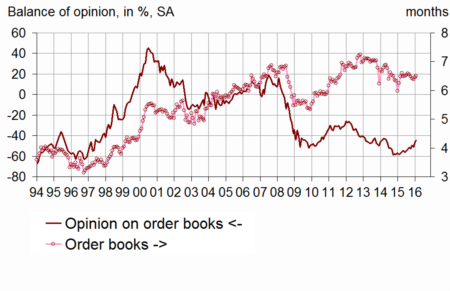
Order books are still considered much lower than normal
Business managers continue to consider that their order books are much lower than normal. However, the corresponding balance has improved gradually, hitting its highest level since early 2014. With their staff size, business managers consider that their order books provide 6.5 months of work, a level stable and above its long term average (5.4 months).
graphiqueOrderBooks – Order books
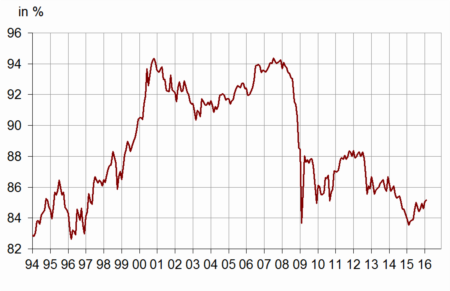
Production capacity stays underused
Since 2008, the production capacity utilisation rate has stood below its long-term average. In February 2016, it is virtually stable at 85.2 %. Almost one business manager out of five has reported difficulties in increasing output, against one out of three in average since 1993.
graphiquePcur – Production capacity utilisation rate
Prices have been reported down again
In February 2016, slightly more business managers than in January have forecasted price falls. The corresponding balance remains substantially below its long-term average.
Documentation
Methodology (2016) (pdf,170 Ko)
Pour en savoir plus
