


Quarterly national accounts in Q3 2015 National accounts in base 2010 - Detailed results
In Q3 2015, GDP increased by 0.3% Quarterly national accounts - second estimate - 3rd Quarter 2015
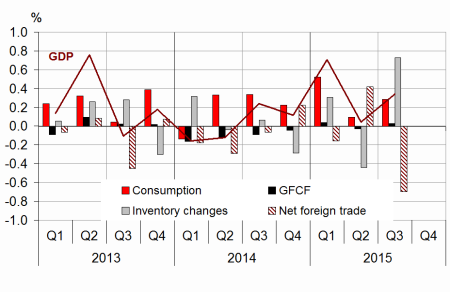
In Q3 2015, GDP in volume terms* increased by 0.3%, after a stability in Q2 2015 (0.0%).
In Q3 2015, GDP in volume terms* increased by 0.3%, after a stability in Q2 2015 (0.0%).
Household consumption expenditure recovered (+0.3% after 0.0%). Non-financial enterprises' GFCF accelerated slightly (+0.7% after +0.5%) and that of households declined less than in Q2 (-0.5% after –1.1%). Overall, total domestic demand (excluding inventory changes) accelerated: it contributed for +0.3 points to GDP growth after +0.1 points in Q2. Exports fell back (–0.6% after +1.9%) while imports sped up (+1.7% after +0.5%). In fine, foreign trade balance contributed negatively to GDP change (–0.7 points after +0.4 points in the last quarter). Conversely, changes in inventories contributed positively (+0.7 points after –0.4 points).
Total production recovered
Production in goods and services picked up in Q3 (+0.4%), after a virtual stability in Q2 (–0.1%). Output in manufactured goods bounced back (+0.3% after –0.6%), particularly in coke and refined petroleum branch that dropped in Q2 because of the temporary shutdown of refineries. Production in market services accelerated slightly (+0.6% after +0.3%). By contrast, activity in construction kept on declining (–0.8% after –0.9%).
Household consumption increased again
In Q3 2015, household consumption expenditure recovered (+0.3% after 0.0%). Expenditure on energy rebounded (+1.6% after –2.1%), especially in gas and electricity. Consumption of automobiles levelled off, after having increased during the last two quarters. Consumption of services still increased moderately (+0.2% as in the previous quarter).

* This growth rate is seasonally and working-day adjusted; volumes are chain-linked previous-year-prices volumes.
graphiqueGraph1 – GDP and its main components
- Source: Insee
tableauTab1 – Goods and services:supply and uses chain-linked volumes
| 2014 Q4 | 2015 Q1 | 2015 Q2 | 2015 Q3 | 2014 | 2015 (ovhg) | |
|---|---|---|---|---|---|---|
| GDP | 0.1 | 0.7 | 0.0 | 0.3 | 0.2 | 1.1 |
| Imports | 1.8 | 1.9 | 0.5 | 1.7 | 3.9 | 5.5 |
| Household consumption *expenditure | 0.2 | 0.8 | 0.0 | 0.3 | 0.6 | 1.4 |
| General government's *consumption expenditure | 0.5 | 0.3 | 0.3 | 0.4 | 1.5 | 1.5 |
| GFCF | -0.2 | 0.2 | -0.1 | 0.1 | -1.2 | -0.4 |
| *of which Non-financial corporated and unincorporated enterprises | 0.1 | 0.8 | 0.5 | 0.7 | 2.0 | 1.8 |
| Households | -0.4 | -0.8 | -1.1 | -0.5 | -5.3 | -3.0 |
| General government | -1.0 | -0.3 | -0.8 | -1.0 | -6.9 | -3.9 |
| Exports | 2.7 | 1.5 | 1.9 | -0.6 | 2.4 | 5.3 |
| Contributions : | ||||||
| Internal demand excluding inventory changes | 0.2 | 0.6 | 0.1 | 0.3 | 0.5 | 1.1 |
| Inventory changes | -0.3 | 0.3 | -0.4 | 0.7 | 0.2 | 0.2 |
| Net foreign trade | 0.2 | -0.2 | 0.4 | -0.7 | -0.5 | -0.2 |
- Source: Insee
tableauTab2 – Sectoral accounts
| 2014 Q4 | 2015 Q1 | 2015 Q2 | 2015 Q3 | 2014 | 2015 (ovhg) | |
|---|---|---|---|---|---|---|
| Profit ratio of NFC* (level) | 29.7 | 31.1 | 31.0 | 29.5 | ||
| Household purchasing power | 0.0 | 1.1 | -0.2 | 1.1 | 1.3 |
- *NFC: non-financial corporations
- Source: Insee
tableauTab3 – Production. consumption and GFCF: main components
| 2014 Q4 | 2015 Q1 | 2015 Q2 | 2015 Q3 | 2014 | 2015 (ovhg) | |
|---|---|---|---|---|---|---|
| Production of branches | 0.1 | 0.8 | -0.1 | 0.4 | 0.7 | 1.2 |
| Goods | -0.5 | 1.5 | -0.7 | 0.2 | 0.1 | 1.1 |
| Manufactured Industry | -0.1 | 1.3 | -0.6 | 0.3 | 0.3 | 1.2 |
| Construction | -0.6 | -0.6 | -0.9 | -0.8 | -2.2 | -2.9 |
| Market services | 0.4 | 0.8 | 0.3 | 0.6 | 1.2 | 1.9 |
| Non-market services | 0.3 | 0.3 | 0.3 | 0.3 | 1.3 | 1.2 |
| Household consumption | 0.2 | 0.8 | 0.0 | 0.3 | 0.6 | 1.4 |
| Food products | 0.3 | 0.2 | 0.8 | -0.2 | 0.2 | 1.0 |
| Energy | -1.6 | 3.9 | -2.1 | 1.6 | -5.7 | 2.6 |
| Engineered goods | 0.7 | 1.7 | -0.1 | 1.0 | 1.8 | 2.8 |
| Services | 0.1 | 0.3 | 0.2 | 0.2 | 0.7 | 0.8 |
| GFCF | -0.2 | 0.2 | -0.1 | 0.1 | -1.2 | -0.4 |
| Manufactured goods | -0.5 | 1.0 | -0.1 | 0.8 | 1.3 | 1.1 |
| Construction | -0.5 | -0.8 | -1.0 | -0.8 | -3.4 | -3.2 |
| Market services | 0.4 | 0.9 | 1.0 | 0.9 | 0.4 | 2.7 |
- Source: Insee
tableauTab4 – Households' disposable income and ratios of households' account
| 2014 Q4 | 2015 Q1 | 2015 Q2 | 2015 Q3 | 2014 | 2015 (ovhg) | |
|---|---|---|---|---|---|---|
| HDI | -0.1 | 1.0 | 0.2 | 1.1 | 1.4 | |
| Household purchasing power | 0.0 | 1.1 | -0.2 | 1.1 | 1.3 | |
| HDI by cu* (purchasing power) | -0.1 | 1.0 | -0.3 | 0.7 | 1.0 | |
| Adjusted HDI (purchasing power) | 0.1 | 0.9 | -0.1 | 1.3 | 1.3 | |
| Saving rate (level) | 15.0 | 15.3 | 15.1 | 15.1 | ||
| Financial saving rate (level) | 6.0 | 6.4 | 6.3 | 6.0 |
- *cu: consumption unit
- Source: Insee
tableauTab5 – Ratios of non-financial corporations' account
| 2014 Q4 | 2015 Q1 | 2015 Q2 | 2015 Q3 | 2014 | |
|---|---|---|---|---|---|
| Profit share | 29.7 | 31.1 | 31.0 | 29.5 | |
| Investment ratio | 23.0 | 22.8 | 23.0 | 23.1 | |
| Savings ratio | 18.3 | 19.2 | 19.4 | 17.4 | |
| Self-financing ratio | 79.4 | 84.0 | 84.4 | 75.2 |
- Source: Insee
tableauTab6 – Expenditure. receipts and net borrowing of public administrations
| 2014 Q4 | 2015 Q1 | 2015 Q2 | 2015 Q3 | 2014 | |
|---|---|---|---|---|---|
| In billions of euros | |||||
| Total expenditure | 307.5 | 309.7 | 311.5 | 1226.9 | |
| Total receipts | 286.9 | 289.9 | 290.5 | 1142.6 | |
| Net lending (+) or borrowing (-) | -20.6 | -19.8 | -21.0 | -84.3 | |
| In % of GDP | |||||
| Net lending (+) or borrowing (-) | -3.8 | -3.6 | -3.9 | -3.9 |
- Source: Insee
Investment was virtually stable
In Q3 2015 like in Q2, total GFCF was almost stable (+0.1% after –0.1%). Investment in manufactured goods bounced back (+0.8% after –0.1%): investment in transport equipment recovered (+0.3% after –1.8%), and investment in equipment goods accelerated (+1.9% after +1.5%). Investment in market services kept on increasing (+0.9% after +1.0%). By contrast, investment in construction decreased again, albeit somewhat less than in the previous quarter (–0.8% after –1.0%).
Non-financial enterprises' GFCF accelerated slightly (+0.7% after +0.5%). Households' one declined more moderately than in Q2 (–0.5% after –1.1%). By contrast, general government's GFCF decreased more sharply (–1.0% after –0.8%).
Foreign trade balance contributed negatively to growth
In Q3, exports decreased (–0.6% after +1.9%), especially in transport equipment (–5.5% after +8.5%). By contrast, imports accelerated sharply (+1.7% after +0.5%), especially in oils.
All in all, foreign trade contributed negatively to GDP anew: –0.7 points in Q3 after +0.4 points in Q2.
Changes in inventories contributed positively to activity
Changes in inventories participated in GDP growth: they contributed for +0.7 points after –0.4 points in Q2. Transport equipment alone contributed for +0.4 points of GDP, thus compensating the contribution of the trade balance of these goods.1
Revisions
Changes in GDP in Q1 (+0.7%) and in Q2 2015 (0.0%) were confirmed. Revisions on previous quarters were small-scale.
1. In the other transport equipment (planes, boats, trains, etc.), changes in inventories show more the existing gap between the measurement of production (work in progress) and that of foreign exchanges (delivery) than short-term behaviour of storage management.
Avertissement
Quarterly national accounts
Quarterly debt of the general government
Sources
Quarterly national accounts
Quarterly accounts are a consistent set of indicators which provides a global overview of recent economic activity.
Time series of the main aggregates of quarterly national accounts can be accessed through the "Summary". They are classified into eight categories:
- Gross domestic product (GDP) and main economic aggregates ;
- Goods and services ;
- Households' consumption ;
- Foreign trade ;
- Activities ;
- Institutional sectors ;
- Households' income and purchasing power ;
- Public finances.
For each category, are available :
- synthetic files displaying from the accounts the relevant information for economic analysis ,
- sometimes, one or two files displaying all the data available.
Documentation
Abbreviated methodology (pdf, 140 Ko )
Methodology - First estimate at 30 days (pdf, 112 Ko )