


Quarterly national accounts in Q3 2015 National accounts in base 2010 - Detailed results
In Q3 2015, households' purchasing power bounced back and corporations' profit ratio increased Quarterly national accounts - detailed figures - 3rd Quarter 2015
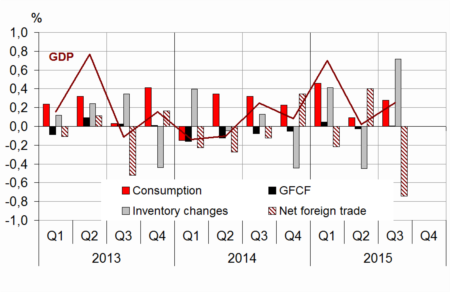
In Q3 2015, gross domestic product (GDP) in volume terms* increased by 0.3% after a stability in Q2 2015. The previous estimate, released on 13 November 2015, is thus confirmed.
In Q3 2015, gross domestic product (GDP) in volume terms* increased by 0.3% after a stability in Q2 2015. The previous estimate, released on 13 November 2015, is thus confirmed.
Households' consumption expenditure recovered (+0.3% after +0.0%). Non-financial enterprises' GFCF kept increasing as in Q2 (+0.5%), meanwhile households' gross fixed capital formation (GFCF) declined again, but to a lesser extent than in the previous quarter (–0.5% after –1.1%). Overall, total domestic demand excluding inventory changes accelerated slightly: it contributed for +0.3 points to GDP growth, after +0.1 points in Q2.
Exports fell back (–0.6% after +2.0%) while imports sped up (+1.8% after +0.7%). In fine, foreign trade balance contributed negatively to activity (–0.7 points after +0.4 points in Q2). Conversely, changes in inventories contributed positively (+0.7 points after –0.5 points).
Households' purchasing power bounced back (+0.9% after –0.3%)
Households' gross disposable income (GDI) accelerated in Q3 (+0.7% after +0.2%). Wages earned by households increased more than in the previous quarter (+0.4% after +0.2%), mainly because the average wage per capita paid by non-financial corporations increased again (+0.3% after +0.0%).
Moreover, social benefits in cash accelerated slightly (+0.3% after +0.2% in Q2), whereas taxes on income and wealth fell back in Q3 (–2.0% after +0.4%).

* This growth rate is seasonally and working-day adjusted; volumes are chain-linked previous-year-prices volumes.GDP and its main components
graphiqueGraph1 – GDP and its main components
- Source: Insee
tableauTab1 – Goods and services:supply and uses chain-linked volumes
| 2014 Q4 | 2015 Q1 | 2015 Q2 | 2015 Q3 | 2014 | 2015 (ovhg) | |
|---|---|---|---|---|---|---|
| GDP | 0.1 | 0.7 | 0.0 | 0.3 | 0.2 | 1.0 |
| Imports | 1.5 | 2.2 | 0.7 | 1.8 | 3.9 | 5.8 |
| Household consumption *expenditure | 0.2 | 0.7 | 0.0 | 0.3 | 0.6 | 1.4 |
| General government's *consumption expenditure | 0.4 | 0.2 | 0.3 | 0.4 | 1.5 | 1.3 |
| GFCF | –0.2 | 0.2 | –0.1 | 0.0 | –1.2 | –0.4 |
| *of which Non-financial corporated and unincorporated enterprises | 0.0 | 0.8 | 0.5 | 0.5 | 2.0 | 1.7 |
| Households | –0.4 | –0.8 | –1.1 | –0.5 | –5.3 | –3.0 |
| General government | –1.0 | –0.2 | –0.7 | –0.9 | –6.9 | –3.9 |
| Exports | 2.9 | 1.6 | 2.0 | –0.6 | 2.4 | 5.7 |
| Contributions : | ||||||
| Internal demand excluding inventory changes | 0.2 | 0.5 | 0.1 | 0.3 | 0.5 | 1.0 |
| Inventory changes | –0.4 | 0.4 | –0.5 | 0.7 | 0.2 | 0.2 |
| Net foreign trade | 0.3 | –0.2 | 0.4 | –0.7 | –0.5 | –0.2 |
- Source: Insee
tableauTab2 – Sector accounts
| 2014 Q4 | 2015 Q1 | 2015 Q2 | 2015 Q3 | 2014 | 2015 (ovhg) | |
|---|---|---|---|---|---|---|
| Profit ratio of NFC* (level) | 29.7 | 31.1 | 31.0 | 31.2 | 29.5 | |
| Household purchasing power | –0.2 | 1.1 | –0.3 | 0.9 | 1.1 | 1.6 |
- *NFC: non-financial corporations
- Source: Insee
tableauTab3 – Production, consumption and GFCF: main components
| 2014 Q4 | 2015 Q1 | 2015 Q2 | 2015 Q3 | 2014 | 2015 (ovhg) | |
|---|---|---|---|---|---|---|
| Production of branches | 0.0 | 0.8 | –0.1 | 0.2 | 0.7 | 1.1 |
| Goods | –0.6 | 1.7 | –0.7 | 0.2 | 0.1 | 1.2 |
| Manufactured Industry | –0.2 | 1.5 | –0.5 | 0.1 | 0.3 | 1.2 |
| Construction | –0.7 | –0.6 | –0.9 | –0.8 | –2.2 | –2.8 |
| Market services | 0.4 | 0.8 | 0.2 | 0.4 | 1.2 | 1.7 |
| Non-market services | 0.3 | 0.3 | 0.3 | 0.3 | 1.3 | 1.1 |
| Household consumption | 0.2 | 0.7 | 0.0 | 0.3 | 0.6 | 1.4 |
| Food products | 0.3 | 0.2 | 0.8 | –0.2 | 0.2 | 1.0 |
| Energy | –1.6 | 3.8 | –2.1 | 1.8 | –5.7 | 2.6 |
| Engineered goods | 0.8 | 1.6 | –0.1 | 0.9 | 1.8 | 2.7 |
| Services | 0.1 | 0.3 | 0.2 | 0.2 | 0.7 | 0.7 |
| GFCF | –0.2 | 0.2 | –0.1 | 0.0 | –1.2 | –0.4 |
| Manufactured goods | –0.5 | 1.1 | –0.1 | 0.7 | 1.3 | 1.1 |
| Construction | –0.6 | –0.8 | –1.0 | –0.7 | –3.4 | –3.1 |
| Market services | 0.4 | 1.0 | 1.0 | 0.6 | 0.4 | 2.5 |
- Source: Insee
tableauTab4 – Households' disposable income and ratios of households' account
| 2014 Q4 | 2015 Q1 | 2015 Q2 | 2015 Q3 | 2014 | 2015 (ovhg) | |
|---|---|---|---|---|---|---|
| HDI | –0.2 | 1.0 | 0.2 | 0.7 | 1.1 | 1.6 |
| Household purchasing power | –0.2 | 1.1 | –0.3 | 0.9 | 1.1 | 1.6 |
| HDI by cu* (purchasing power) | –0.3 | 1.0 | –0.4 | 0.8 | 0.7 | 1.2 |
| Adjusted HDI (purchasing power) | 0.0 | 0.9 | –0.1 | 0.8 | 1.3 | 1.5 |
| Saving rate (level) | 14.9 | 15.2 | 15.0 | 15.5 | 15.1 | |
| Financial saving rate (level) | 5.9 | 6.4 | 6.2 | 6.8 | 6.0 |
- *cu: consumption unit
- Source: Insee
tableauTab5 – Ratios of non-financial corporations' account
| 2014 Q4 | 2015 Q1 | 2015 Q2 | 2015 Q3 | 2014 | |
|---|---|---|---|---|---|
| Profit share | 29.7 | 31.1 | 31.0 | 31.2 | 29.5 |
| Investment ratio | 23.0 | 22.8 | 23.0 | 22.9 | 23.1 |
| Savings ratio | 18.3 | 19.5 | 19.9 | 20.2 | 17.4 |
| Self-financing ratio | 79.6 | 85.4 | 86.6 | 88.3 | 75.2 |
- Source: Insee
tableauTab6 – Expenditure, receipts and net borrowing of public administrations
| 2014 Q4 | 2015 Q1 | 2015 Q2 | 2015 Q3 | 2014 | |
|---|---|---|---|---|---|
| In billions of euros | |||||
| Total expenditure | 307.8 | 309.0 | 311.4 | 311.3 | 1226.9 |
| Total receipts | 287.4 | 289.8 | 290.1 | 290.5 | 1142.7 |
| Net lending (+) or borrowing (-) | -20.3 | -19.2 | -21.4 | -20.8 | -84.2 |
| In % of GDP | |||||
| Net lending (+) or borrowing (-) | -3.8 | -3.5 | -3.9 | -3.8 | -3.9 |
- Source: Insee
Furthermore, consumption prices declined in Q3 (–0.2% after +0.4%), mainly because of the fall in energy prices. The effect of the gross disposable income acceleration was therefore amplified: households' purchasing power bounced back strongly (+0.9% after –0.3%). Measured per consumption unit to assess it at an individual level, it has a similar profile: +0.8% after –0.4% in Q2.
As households' consumption increased in volume terms much less than their purchasing power, their saving ratio rose, at 15.5% of their GDI after 15.0% in Q2.
Non-financial corporations' profit ratio increased again and reached 31.2%
In Q3 2015, non-financial corporations' profit ratio increased again (+0.3 points, at 31.2%). It is mainly buoyed by the decrease in energy prices which improved the terms of trade. However, real wages increased while productivity gains were zero in Q3, which curbed the rise of the profit ratio.
General government deficit decreased
General government net borrowing decreased by 0.1 points of GDP in Q3, at 3.8% after 3.9%.
Spending was stable (after +0.8% in Q2). Indeed, government debt servicing slipped back (–5.8% after +17.3%) because the price fall has reduced interests on inflation-linked government bonds. This effect outweighed the slight acceleration of operating expenses (+0.4% after +0.3%). Receipts accelerated a little in Q3 (+0.2% after +0.1%), thanks to the buoyancy of corporate taxes.
Next release: On 29 January 2016, Insee will publish a first estimate of the French GDP for Q4 2015, 30 days after the end of the quarter (against 45 days until today). At this time, France will be the only country in Europe to provide not only the GDP, but also a full goods and services account 30 days after the end of each quarter.
Avertissement
Quarterly national accounts
Quarterly debt of the general government
Sources
Quarterly national accounts
Quarterly accounts are a consistent set of indicators which provides a global overview of recent economic activity.
Time series of the main aggregates of quarterly national accounts can be accessed through the "Summary". They are classified into eight categories:
- Gross domestic product (GDP) and main economic aggregates ;
- Goods and services ;
- Households' consumption ;
- Foreign trade ;
- Activities ;
- Institutional sectors ;
- Households' income and purchasing power ;
- Public finances.
For each category, are available :
- synthetic files displaying from the accounts the relevant information for economic analysis ,
- sometimes, one or two files displaying all the data available.
Documentation
Abbreviated methodology (pdf, 140 Ko )
Methodology - First estimate at 30 days (pdf, 112 Ko )