


 23 October 2013
2013- n° 244In October 2013, the business remains almost stable in services Monthly survey of services - October 2013
23 October 2013
2013- n° 244In October 2013, the business remains almost stable in services Monthly survey of services - October 2013
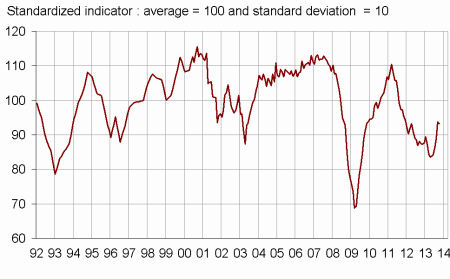
According to business managers, the economic situation in services remains almost stable in October 2013. The business climate composite indicator has lost one point, and is 93. The turning point indicator still indicates a favorable economic outlook dynamic. Business managers consider that the decline in their activity has weakened significantly over the last few months. However, their business expectations for the next three months remains pessimistic. The balance on the general outlook, which traces the assessment of business leaders across the sector remains below its long-term average.
All services sector
According to business managers, the economic situation in services remains almost stable in October 2013. The business climate composite indicator has lost one point, and is 93. The turning point indicator still indicates a favorable economic outlook dynamic. Business managers consider that the decline in their activity has weakened significantly over the last few months. However, their business expectations for the next three months remains pessimistic. The balance on the general outlook, which traces the assessment of business leaders across the sector remains below its long-term average.
Business leaders believe that their operating balance result is still degraded in the recent period, and their expectations for the coming months remain dull.
Expectations of employment are recovering
Expectations of business managers are stabilizing near their long-term average but are still sluggish in services sector except temporary employment agencies.
graphiqueGraph1 – Composite indicator
graphiquegraph_retourn – Turning point indicator
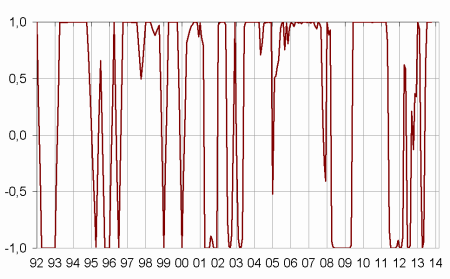
- Note: close to 1 (respectively -1), this indicator indicates a favorable short-term economic situation (respectively unfavorable).
tableauTable_quarter – Economic outlook in the services sector
| Average* | July 13 | Aug. 13 | Sept. 13 | Oct. 13 | |
|---|---|---|---|---|---|
| Composite indicator | 100 | 86 | 89 | 94 | 93 |
| General outlook | –7 | –22 | –20 | –15 | –14 |
| Past activity | 3 | –16 | –16 | –12 | –7 |
| Expected activity | 2 | –14 | –11 | –6 | –7 |
| Expected demand | 0 | –13 | –8 | –2 | –2 |
| Business situation | –2 | –13 | –14 | –10 | –10 |
| Past selling prices | –3 | –12 | –11 | –10 | –11 |
| Expected selling prices | –2 | –13 | –10 | –10 | –10 |
| Past employment | 3 | –6 | –7 | –1 | –4 |
| except temporary work agencies | 1 | –5 | –11 | –6 | –7 |
| Expected employment | 2 | –7 | –4 | –1 | 0 |
| except temporary work agencies | 0 | –10 | –7 | –8 | –7 |
| Investments | |||||
| Past investments | 1 | –5 | –5 | –5 | –4 |
| Expected investments | 1 | 1 | –1 | 1 | 0 |
| Operating balance result | |||||
| Past result | –1 | –8 | –13 | ||
| Expected result | –1 | –16 | –10 | ||
| Cash position | –11 | –16 | –15 | ||
| Difficulties of supply and demand | |||||
| difficulties of supply and demand | 10 | 12 | 12 | ||
| difficulties of supply only | 22 | 17 | 16 | ||
| difficulties of demand only | 31 | 39 | 37 | ||
| Difficulties in recruitment | 29 | 16 | 17 |
- * Average of the balances of opinion since 1988
- Source: Insee
Road transport
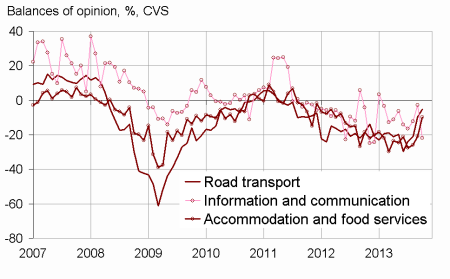
In road freight and mail activities, business managers assess that activity was less degraded in the last months than in previous months. Their expectations of activity are improving.
Accommodation and food service activities
In accommodation and food service activities, business managers judgment on past activity is stable. However, their business expectations for the coming months are more favorable.
Information and communication
In information and communication, business managers indicate that activity has improved over the last few months, but their expectations of activity for the next months are deteriorating.
Real estate activities
In real estate activities, business managers believe that activity has slowed down in recent months. However, they revise upwards their expectations of business for the coming months.
Professional, scientific and technical activities
In professional, scientific and technical activities, more business managers than in September estimate that activity has slightly picked up in the recent period. They continue to anticipate a decline in activity in the months to come.
Administrative and support service activities
In administrative and support service activities, business managers indicate that activity has recovered in the recent period. They revise their expectations of activity upward for the next few months. They continue to predict a rise in employment.
graphiquegraph_bonus_ – Expected activity
tableauTable_det – Detailed data
| A21 | Average* | July 13 | Aug. 13 | Sept. 13 | Oct. 13 |
|---|---|---|---|---|---|
| (H) Road transport | |||||
| Past activity | –8 | –31 | –21 | –19 | –7 |
| Expected activity | –9 | –24 | –21 | –10 | –5 |
| Expected demand | –13 | –29 | –21 | –13 | –6 |
| Past employment | –8 | –9 | –8 | –11 | –7 |
| Expected employment | –11 | –17 | –15 | –11 | –6 |
| (I) Accommodation and food service activities | |||||
| Past activity | –7 | –19 | –21 | –19 | –21 |
| Expected activity | –7 | –27 | –26 | –21 | –10 |
| Expected demand | –9 | –31 | –27 | –14 | –8 |
| Past employment | –4 | –11 | –22 | –11 | –13 |
| Expected employment | –5 | –13 | –17 | –13 | –13 |
| (J) Information and communication | |||||
| Past activity | 11 | –24 | –33 | –28 | –9 |
| Expected activity | 12 | –16 | –12 | –3 | –22 |
| Expected demand | 12 | 0 | 0 | 11 | 6 |
| Past employment | 7 | –7 | –11 | –16 | –10 |
| Expected employment | 12 | –11 | –7 | –5 | –1 |
| (L) Real estate activities | |||||
| Past activity | 7 | –2 | 2 | 4 | 0 |
| Expected activity | 8 | –1 | 0 | 3 | 6 |
| Expected demand | 2 | –4 | –4 | 0 | 2 |
| Past employment | 3 | 1 | –5 | –1 | –4 |
| Expected employment | 2 | –5 | 1 | –5 | –3 |
| (M) Professional, scientific and technical activities | |||||
| Past activity | –1 | –14 | –13 | –9 | –4 |
| Expected activity | –2 | –16 | –9 | –11 | –11 |
| Expected demand | –5 | –21 | –13 | –12 | –10 |
| Past employment | 1 | –4 | –6 | –6 | –6 |
| Expected employment | 0 | –6 | –5 | –7 | –4 |
| (N) Administrative and support service activities | |||||
| Past activity | 6 | –11 | –8 | –3 | 3 |
| Expected activity | 5 | –6 | –3 | 2 | 7 |
| Expected demand | 3 | –8 | 3 | 1 | 1 |
| Past employment | 8 | –6 | 1 | 13 | 2 |
| Expected employment | 6 | 2 | 8 | 13 | 11 |
- * Average of the balances of opinion since 1988 (2006 for road transport)
Documentation
Methodology (2016) (pdf,158 Ko)
Pour en savoir plus
Time series : Economic outlook surveys – Services
