


 14 January 2013
2013- n° 11Decrease in business setting up in December 2012 Enterprise births - December 2012
14 January 2013
2013- n° 11Decrease in business setting up in December 2012 Enterprise births - December 2012
In December 2012, the number of business start-ups decreased compared to November: -15.4% for business setting up (seasonally and working-day adjusted data) including self-managed enterprises; it was slightly compensated by the increase of start-ups excluding self-managed enterprises (+1.5%)
Warning : Only business start-ups data excluding self-managed enterprises (SME) are seasonally adjusted. In February 2012, the seasonal adjustment model has been reviewed. In order to get the total of enterprise births, the raw number of SME is added. The SME time series is too short to be properly deseasonalized.
In December 2012, the number of business start-ups decreased compared to November: -15.4% for business setting up (seasonally and working-day adjusted data) including self-managed enterprises; it was slightly compensated by the increase of start-ups excluding self-managed enterprises (+1.5%).
-2.8% year-on-year (quarterly basis)
The amount of entries added up in the last quarter 2012 decreased compared to the same quarter one year before (-2.8%).
The sectors that most contributed to that decrease were business support service activities and real estate activities.
Business setting up stabilized year-on-year (twelve months basis)
During the last twelve months, the number of business start-ups remained stable year-on-year.
307,478 self-managed enterprises since the beginning of 2012
For the first eleven months of 2012, more than one out of two business setting up were self-managed enterprises (307,478). However with 17 581 business starts-up, it reached the lowest point since regulation’s enforcement except for January 2009.
tableautab0EN – Self-managed business setting up
| Sept. 2012 | Oct. 2012 | Nov. 2012 | Dec. 2012 |
|---|---|---|---|
| 26 289 | 30 838 | 24 753 | 17 581 |
- Source: INSEE (Sirene)
tableautab1EN – Business setting up by month
| sept 2012 | Oct. 2012 | Nov. 2012 | Dec. 2012 | |
|---|---|---|---|---|
| Excl. self-managed enterprises (sa-wda *) | 19 825 | 20 056 | 19 936 | 20 232 |
| Variation [m-o-m] % | -3.5 | 1.2 | -0.6 | 1.5 |
| Incl., in raw data, self-managed enterprises | 46 114 | 50 894 | 44 689 | 37 813 |
| Variation [m-o-m] % | 11.6 | 10.4 | -12.2 | -15.4 |
- * Seasonally and working-day adjusted data
- Source: INSEE (Sirene)
tableautab2EN – business start-ups by type
| Moving total % change* | Moving total | Moving total | ||
|---|---|---|---|---|
| over 3 months | over 12 months | January- December 2012 | January- December 2011 | |
| Total | -2.8 | 0.0 | 549 975 | 549 805 |
| Companies | -5.3 | -4.3 | 159 529 | 166 674 |
| Individual enterprises | -1.7 | 1.9 | 390 446 | 383 131 |
| Of which self-managed | -0.5 | 5.4 | 307 478 | 291 721 |
- * Total of enterprises births during the last 3 or 12 months compared with the same months a year earlier
- // = meaningless
- Source: INSEE (Sirene)
graphiqueGraph1EN – Business start-ups
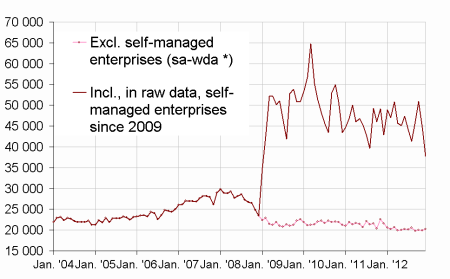
- * Seasonally and working-day adjusted data
- Source: INSEE (Sirene)
Pour en savoir plus
Time series : Business demography
