


 25 October 2013
2013- n° 246In October 2013, the demand for new dwellings stays dull Quaterly business survey in the real-estate development - October 2013
25 October 2013
2013- n° 246In October 2013, the demand for new dwellings stays dull Quaterly business survey in the real-estate development - October 2013
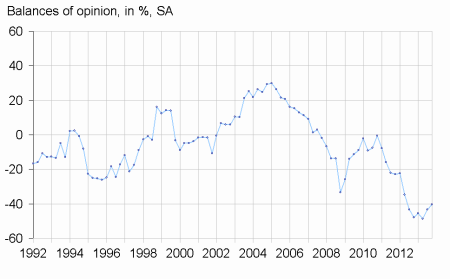
In October 2013, according to property developers, the demand for new dwellings stays low. The corresponding balance of opinion has gone up slightly, but stays significantly below its long-term average. Business managers forecast a slight amelioration of the housing starts for the next three months, linked to the improvment of the housing starts for sale. Nevertheless, the corresponding balance of opinion remains below its long-term average.
The demand for new dwellings stays sluggish
In October 2013, according to property developers, the demand for new dwellings stays low. The corresponding balance of opinion has gone up slightly, but stays significantly below its long-term average. Business managers forecast a slight amelioration of the housing starts for the next three months, linked to the improvment of the housing starts for sale. Nevertheless, the corresponding balance of opinion remains below its long-term average.
Unsold dwelling stock might remain high
The balance of opinion on unsold dwelling stock has increased slightly, and is sharply above its long-term average.
Less developers indicate a drop in prices
In October, fewer developers than in July, indicate a fall in average price of new housing; but the corresponding balance of opinion is again significantly below its long-term average. Their opinion about the downpayment to acquire a new dwelling is slightly degraded compared to the previous quarter. As many developers as in July, indicate a decrease in the financing capacity to purchase a new housing.
tableautableau1 – Building construction economic outlook
| Mean* | Jan. 13 | April 13 | July 13 | Oct. 13 | |
|---|---|---|---|---|---|
| New dwelling demand | –6 | –45 | –49 | –43 | –40 |
| Expected housing starts | –6 | –27 | –30 | –28 | –21 |
| - for sale | –14 | –44 | –40 | –45 | –29 |
| - for rent | 1 | –4 | –16 | –3 | –5 |
| Unsold dwelling stock tendency | –27 | –16 | –20 | –20 | –16 |
| Housing average price for sale | 7 | –20 | –22 | –26 | –20 |
| Downpayment | –20 | –40 | –40 | –43 | –46 |
| Financing capacity | –22 | –50 | –62 | –48 | –48 |
- * Mean since July 1991.
graphiqueDemand – New dwelling demand tendency
Pour en savoir plus
