


 24 April 2013
2013- n° 97In April 2013, the demand for new dwellings stays dull Quaterly business survey in the real-estate development - April 2013
24 April 2013
2013- n° 97In April 2013, the demand for new dwellings stays dull Quaterly business survey in the real-estate development - April 2013
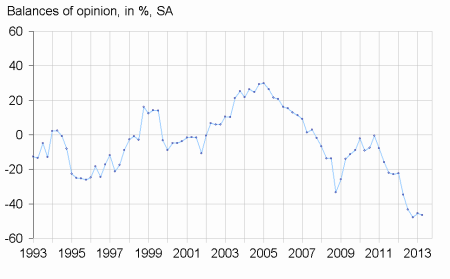
In April 2013, according to the developers, the demand for new dwellings stays degraded. The corresponding balance of opinion is significantly below its long-term average. The business leaders forecast a slight deterioration of the housing starts for the next three months, linked to the decline of the housing starts for rent. The corresponding balance of opinion remains below its long-term average.
The demand for new dwellings stays sluggish
In April 2013, according to the developers, the demand for new dwellings stays degraded. The corresponding balance of opinion is significantly below its long-term average. The business leaders forecast a slight deterioration of the housing starts for the next three months, linked to the decline of the housing starts for rent. The corresponding balance of opinion remains below its long-term average.
Unsold dwelling stock would reduce
The developers are more numerous than in January to indicate a decrease of their unsold dwelling stocks this quarter.
The developers are slightly more numerous to indicate a drop of prices
According to developers, new housing average price would slow down; the corresponding balance of opinion is below its long-term average. Their opinion about the downpayment to acquire a new dwelling is almost stable compared to the previous quarter. The developers are more numerous to indicate a decrease of the financing capacity to purchase a new housing.
tableautableau1 – Building construction economic outlook
| Mean* | July 12 | Oct. 12 | Jan. 13 | April 13 | |
|---|---|---|---|---|---|
| New dwelling demand | –5 | –43 | –48 | –45 | –46 |
| Expected housing starts | –5 | –32 | –26 | –27 | –30 |
| - for sale | –14 | –51 | –38 | –44 | –38 |
| - for rent | 1 | –9 | –6 | –4 | –18 |
| Unsold dwelling stock tendency | –27 | –3 | –12 | –16 | –23 |
| Housing average price for sale | 8 | –18 | –28 | –20 | –22 |
| Downpayment | –19 | –31 | –38 | –40 | –41 |
| Financing capacity | –21 | –56 | –65 | –50 | –64 |
- * Mean since July 1991.
graphiqueDemand – New dwelling demand tendency
Pour en savoir plus
