


 22 April 2010
2010- n° 108In April 2010, the economic climate in services improves strongly Monthly survey of services - April 2010
22 April 2010
2010- n° 108In April 2010, the economic climate in services improves strongly Monthly survey of services - April 2010
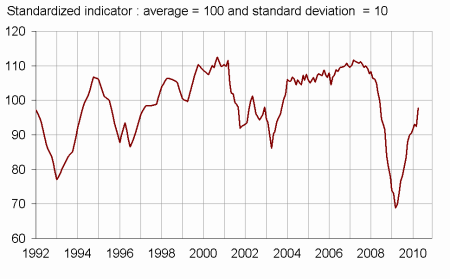
According to the business leaders surveyed in April, the economic situation in services improves strongly. The synthetic indicator rises by six points and gets closer to its long-term average of 100.

Warning: Business surveys are now published according to the French economic activities and products classification, NAF rev. 2.
From now on, the results of the survey include the answers of business leaders in the sector of freight transport by road and freight services organization. These business leaders have been surveyed since February 2006.
According to the business leaders surveyed in April, the economic situation in services improves strongly. The synthetic indicator rises by six points and gets closer to its long-term average of 100.
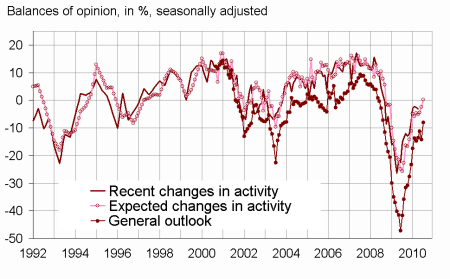
The business leaders surveyed consider that the general outlook in services has improved markedly since March. They expect demand to surge in the months to come.
They consider that their activity kept increasing at the same pace during the last few months, and that it should accelerate slightly in the next few months.
The operating balance result rose markedly in the last few months, and it should continue to rise at the same pace.
graphiqueGraph1 – Business climate synthetic indicator
graphiqueGraph2 – Activity
tableauTab_ens_trim – Economic outlook in the services sector
| Average* | Jan. 10 | Feb. 10 | Mar. 10 | Apr. 10 | |
|---|---|---|---|---|---|
| Business climate synthetic indicator | 100 | 92 | 93 | 92 | 98 |
| General outlook | –5 | –13 | –11 | –14 | –8 |
| Past activity | 4 | –3 | –2 | –3 | –3 |
| Expected activity | 4 | –5 | –4 | –2 | 0 |
| Expected demand | 1 | –6 | –6 | –5 | 2 |
| Business situation | 0 | –5 | –4 | –4 | –4 |
| Past selling prices | –2 | –12 | –12 | –11 | –14 |
| Expected selling prices | –1 | –10 | –10 | –6 | –7 |
| Past employment | 3 | –9 | –8 | –5 | –1 |
| except temporary work agencies | 1 | –9 | –10 | –7 | –4 |
| Expected employment | 3 | –8 | –6 | –5 | –7 |
| except temporary work agencies | 0 | –7 | –7 | –5 | –6 |
| Investments | |||||
| Past investments | 2 | –3 | –2 | –5 | –4 |
| Expected investments | 1 | –7 | –6 | –2 | 0 |
| Operating balance result | |||||
| Past result | –1 | –11 | –2 | ||
| Expected result | 0 | –6 | 0 | ||
| Cash position | –10 | –18 | –15 | ||
| Difficulties of supply and demand | |||||
| difficulties of supply and demand | 9 | 11 | 10 | ||
| difficulties of supply only | 23 | 20 | 20 | ||
| difficulties of demand only | 29 | 38 | 39 | ||
| Difficulties in recruitment | 32 | 20 | 21 | ||
| executives | 24 | 14 | 14 | ||
| other types of staff | 13 | 6 | 7 |
- * Average of the balances of opinion since 1988
- Source: Insee
Documentation
Methodology (2016) (pdf,158 Ko)
Pour en savoir plus
Time series : Economic outlook surveys – Services
