

 11 September 2018
2018- n° 236In Q2 2018, payroll employment slowed down in the private business sector and declined
in public service Payroll employment - second quarter 2018
11 September 2018
2018- n° 236In Q2 2018, payroll employment slowed down in the private business sector and declined
in public service Payroll employment - second quarter 2018
In Q2 2018, net payroll job creation reached+12,500, after +47,500 in the previous quarter (that is 0.0 %, after +0.2 %). Payroll employment declined again in the public sector (-11,800), and slowed down in the private sector (+24,300). Year on year, it rose by 207,600 (+0.8 %): 236,000 jobs were created in the private sector and 28,300 jobs were destroyed in the public service.

Warning: The introduction of the “Déclaration Sociale Nominative” (DSN) to replace the “bordereau récapitulatif de cotisations” (BRC) may affect transitorily the declarative behavior of businesses. During the ramp-up phase of the DSN, adjustments are made in the statistical processing chain of employment estimates to reflect these changes. These changes are likely to generate more revisions than usual to data.
Payroll employment slowed down in Q2 2018
In Q2 2018, net payroll job creation reached+12,500, after +47,500 in the previous quarter (that is 0.0 %, after +0.2 %). Payroll employment declined again in the public sector (-11,800), and slowed down in the private sector (+24,300). Year on year, it rose by 207,600 (+0.8 %): 236,000 jobs were created in the private sector and 28,300 jobs were destroyed in the public service.
Payroll employment barely decreased in industry and continued to grow strongly in construction
Payroll employment decreased slightly in industry in Q2 2018 (that is – 2,200, after – 400), showing nonetheless a year on year increase (+5,000).
The growth of payroll employment in construction continued at the same pace than in the previous quarter : +5,000 (that is +0.4 % as in Q1 2018). Year on year, the increase reached +25,300 jobs (that is +1.9 %).
Payroll employment slowed down in market services and fell back a little in temporary work
In Q2 2018, payroll employment increased by 23,400 in the market services, that is +0.2 %, after +0.3 % in the previous quarter. Year on year, the market service sector as a whole supported the large majority of payroll employment growth: +194,900, that is +1.6 %.
Temporary employment declined slightly in Q2 2018 for the first time since summer 2014: – 2,900 jobs i.e. -0.4 % after +0.3 % in Q1 2018. Over a year, it was still sharply increasing: +49,500, that is +6.5 %. Employment in services excluding temporary work increased by +26,400 jobs in Q2 2018 (i.e. +0.2 %, after +0.3 %). Over a year, the market service sector excluding temporary work expanded by 145,400 jobs (+1.3 %).
tableauTableau1 – Payroll employment change: thousands
| Change in 3 months | Change in 1 year | Level | ||
|---|---|---|---|---|
| 2018 | 2018 | 2018 | 2018 | |
| Q1 | Q2 | Q2 | Q2 | |
| Agriculture | 3.0 | 0.2 | 3.6 | 306.8 |
| Goods-producing industries excl. Construction | -0.4 | -2.2 | 5.0 | 3, 142.8 |
| of which : Manufacturing | 0.1 | -1.8 | 6.4 | 2, 778.2 |
| Construction | 5.1 | 5.0 | 25.3 | 1, 367.7 |
| Market services | 38.1 | 23.4 | 194.9 | 12, 315.3 |
| of which : Temporary employment (*) | 2.3 | -2.9 | 49.5 | 811.0 |
| Non-market services | 1.8 | –14,0 | -21.3 | 8, 047.3 |
| Total (*) | 47.5 | 12.5 | 207.6 | 25, 179.8 |
| Private sector (*) | 48.8 | 24.3 | 236.0 | 19, 399.7 |
| Public service | -1.3 | -11.8 | -28.3 | 5, 780.2 |
- How to read it: In Q2 2018, net job creation in market services amounted to 23,400 jobs from the previous quarter
tableauTableau2 – Payroll employment change: percentage
| Change in 3 months | Change in 1 year | ||
|---|---|---|---|
| 2018 | 2018 | 2018 | |
| Q1 | Q2 | Q2 | |
| Agriculture | 1.0 | 0.1 | 1.2 |
| Goods-producing industries excl. Construction | 0.0 | -0.1 | 0.2 |
| of which : Manufacturing | 0.0 | -0.1 | 0.2 |
| Construction | 0.4 | 0.4 | 1.9 |
| Market services | 0.3 | 0.2 | 1.6 |
| of which : Temporary employment (*) | 0.3 | -0.4 | 6.5 |
| Non-market services | 0.0 | -0.2 | -0.3 |
| Total | 0.2 | 0.0 | 0.8 |
| Private sector | 0.3 | 0.1 | 1.2 |
| Public service | 0.0 | -0.2 | -0.5 |
- (*) Temporary workers are recorded in services, regardless of the sector in which they carry out their mission effectively.
- Scope : France excluding Mayotte
- Source: Acoss-Urssaf, Dares, INSEE
Employment stabilized in public service
Employment in mainly non-market services decreased in Q2 2018: – 14,000 jobs, after +1,800 in the previous quarter. After a near-stability in Q1 2018 (– 1,300 jobs), public service decreased (– 11,800) because of the decline in the number of subsidised employment contracts. Over a year, mainly non-market services decreased by – 21,300 jobs (of which – 28,700 in public service).
Revisions
Compared to the employment estimate published on 12 June 2018, net job creation of Q1 2018 has been barely revised (– 1,300 jobs). Compared to the flash estimate focused on the private sector published on 10 August 2018, net job creation in Q2 2018 has been revised downwards by 6,700, especially due to temporary work and market services.
graphiquegraphique – Variation in payroll employment in thousands
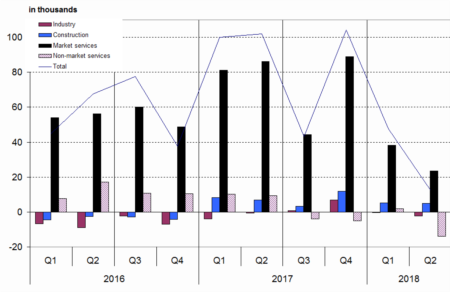
- Scope : France excluding Mayotte.
- Sources: Acoss-Urssaf, Dares, INSEE
tableauTableau3 – Payroll employment change (*)
| Code | Change in | Change in | Niveau | ||
|---|---|---|---|---|---|
| 3 months | 1 year | ||||
| Naf | 2018 | 2018 | 2018 | 2018 | |
| rev.2 | Q1 | Q2 | Q2 | Q2 | |
| AZ | Agriculture | 3.0 | 0.2 | 3.6 | 306.8 |
| DE | Electricity, gas, steam, and air conditioning supply | -0.5 | -0.4 | -1.4 | 364.6 |
| C1 | Manufacture of food products beverage and tobacco products | 0.9 | 0.9 | 4.7 | 578.0 |
| C2 | Manufacture of coke, and refined petroleum products | 0.0 | 0.0 | -0.1 | 9.2 |
| C3 | Manufacture of computer, electronic and electrical products | -0.4 | -0.8 | 0.5 | 418.5 |
| C4 | Manufacture of transport equipment | -0.4 | -0.9 | -0.3 | 344.2 |
| C5 | Other manufacturing | 0.1 | -0.9 | 1.6 | 1, 428.3 |
| FZ | Construction | 5.1 | 5.0 | 25.3 | 1, 367.7 |
| GZ | Wholesale and retail trade | 6.7 | 2.9 | 25.5 | 3, 153.2 |
| HZ | Transportation and storage | 5.0 | 5.1 | 15.1 | 1,397.3 |
| IZ | Accommodation and food service activities | 12.6 | 8.5 | 34.5 | 1,102.3 |
| JZ | Information and communication | 6.7 | 3.4 | 22.7 | 775.7 |
| KZ | Financial and insurance activities | -1.5 | -0.8 | -1.4 | 870.1 |
| LZ | Real estate activities | -0.6 | -0.5 | -1.6 | 240.4 |
| MN | Professional, scientific and technical activities | 12.1 | 8.2 | 111.3 | 3, 458.3 |
| of which : Temporary employment | 2.3 | -2.9 | 49.5 | 811.0 | |
| OQ | Public administration and defence ; education; human health and social work act.ivities | 1.8 | -14.0 | -21.3 | 8, 047.3 |
| RU | Other service activities | -2.9 | -3.5 | -11.3 | 1, 318.0 |
- Scope : France excluding Mayotte.
- Sources: Acoss-Urssaf, Dares, INSEE
tableauTableau4 – Revisions of payroll employment in Q1 2018 and Q2 2018
| Change in 3 months | ||||
|---|---|---|---|---|
| Payroll employment | Private scope only | |||
| (12/06/2018) | (flash estimate) | |||
| New estimation | Rev. Q1 2018 | New estimation | Rev. Q2 2018 | |
| Agriculture | 3.0 | 0.0 | 0.2 | 0.0 |
| Goods-producing industries | -0.4 | 0.4 | -2.4 | 1.4 |
| Construction | 5.1 | 1.5 | 5.0 | 0.9 |
| Market services | 38.1 | -1.0 | 23.8 | -5.8 |
| of which : Temporary work employment (*) | 2.3 | -2.2 | -2.9 | -4.0 |
| Non-market services | 1.8 | -2.1 | -2.3 | -3.3 |
| Total | 47.5 | -1.3 | 24.3 | -6.7 |
| Private sector | 48.8 | 1.1 | ||
| Public service | -1.3 | -2.4 | ||
- (*) Temporary workers are recorded in services, regardless of the sector in which they carry out their mission effectively.
- Scope : France excluding Mayotte
- Sources: Acoss-Urssaf, Dares, INSEE