

 Insee Première ·
November 2021 · n° 1881
Insee Première ·
November 2021 · n° 1881 68.1 million inhabitants in 2070: a population that would be slightly larger, but
older, than in 2021
68.1 million inhabitants in 2070: a population that would be slightly larger, but
older, than in 2021
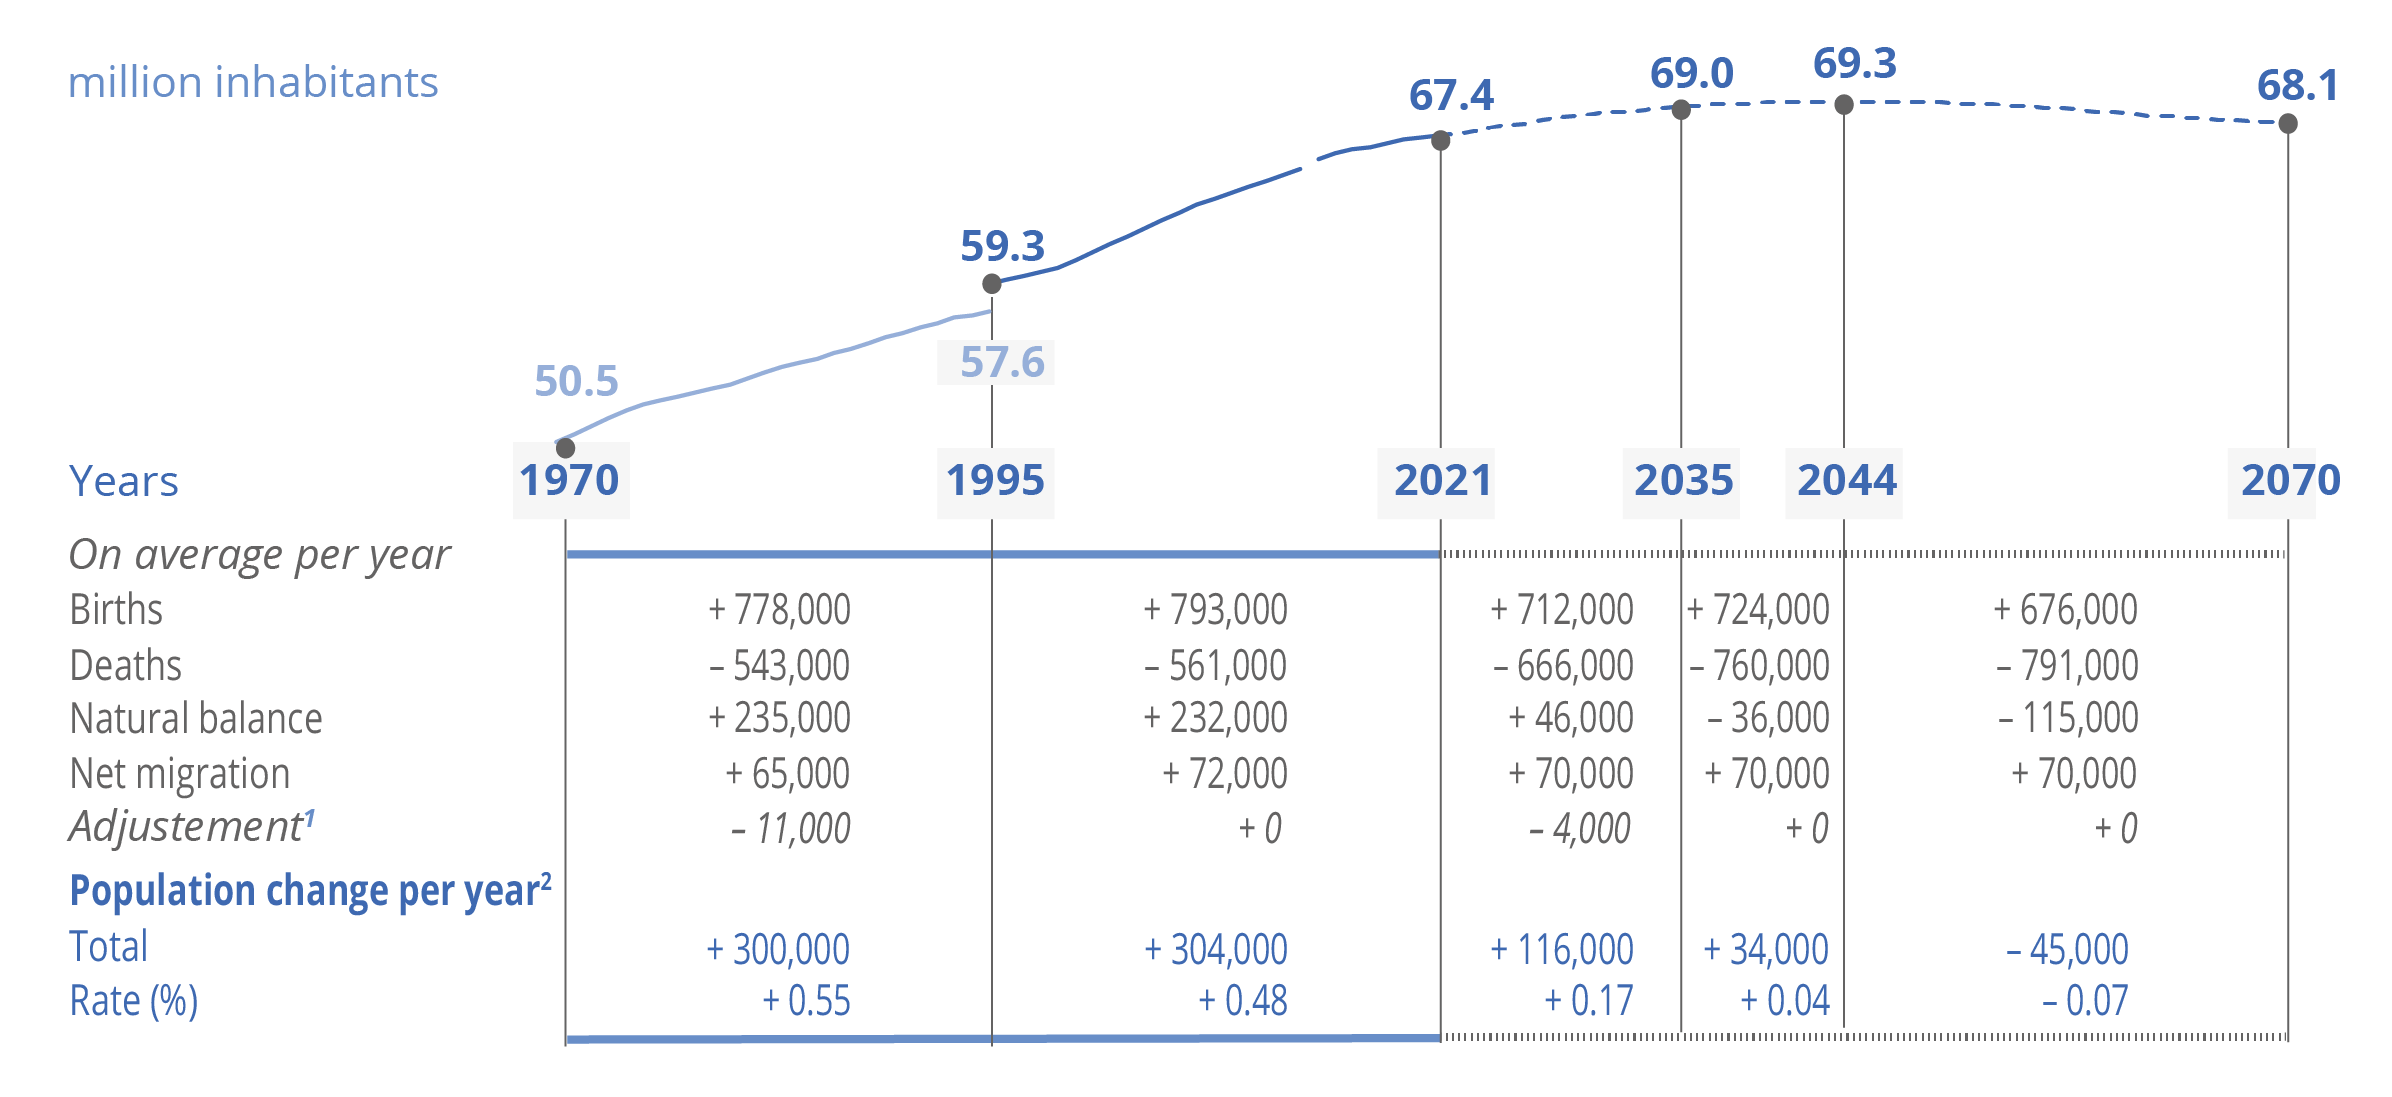
If recent demographic trends were to continue, the population of France would increase until 2044 to reach 69.3 million inhabitants. It would then decrease to 68.1 million inhabitants in 2070, i.e. 700,000 more than in 2021.
By 2070, the age pyramid would change significantly. The number of people aged 60 to 74 would remain stable, the number of people aged 75 or over would increase by 5.7 million, while the number of people under 60 would decrease by 5.0 million. Driven by the increase in the number of people aged 75 or over, the share of people aged 65 or over in the population is expected to rise sharply, from 21% to 29%. It would thus grow at the same rate as in the past, between 1972 and 2021.
It is almost certain that the population will continue to age until 2040. The extent of this ageing varies little according to the assumptions used. In 2040, there would be 51 people aged 65 or over per 100 people aged 20 to 64, compared with 37 in 2021. Between 2040 and 2070, the evolution of this old-age dependency ratio is much more uncertain and depends more on the assumptions made.
- Deaths set to surpass births from 2035 onwards
- Fertility and migration have the greatest impact on population change
- By 2070: +5.7 million people aged 75 or over, –5.0 million under 60s
- Between now and 2040, the proportion of 65 and overs would increase at the same rate as in the past
- From now to 2040, the continued ageing of the population is unavoidable
- Box – How do we estimate the number of inhabitants in France in 2070?
Deaths set to surpass births from 2035 onwards
If recent demographic trends were to continue, France would have 68.1 million inhabitants by 1 January 2070, which is 700,000 more than in 2021 (Chart 1). In this baseline scenario (box), the risks of death broken down by gender and age would reduce at the same rate as over the 2010s, fertility would stabilise at 1.8 children per woman and the net migration would be an additional 70,000 inhabitants per year.
graphiqueChart 1 - Population change from 1970 to 2070 (baseline scenario)
- 1. For some years, an adjustment component is introduced to ensure consistency between, on the one hand, the change in the population of France deduced from the results of two censuses and, on the other hand, the components of this change, the natural balance and the migratory balance, estimated elsewhere. The last adjustment, linked to a change in the population census questionnaire in 2018, will be visible for 8 years, from 2015 to 2022, given the census method. It is therefore taken into account during the first two years of the projection, 2021 and 2022.
- 2. Population change is the sum of the natural balance and the net migration.
- Reading note: from 1 January 2021 to 1 January 2035, according to the baseline scenario, the population is set to increase by an average of 116,000 people (0.17%) per year.
- Coverage: Metropolitan France from 1970 to 1995, France excluding Mayotte from 1995 to 2013, France from 2014 onwards.
- Source: INSEE, population estimates, vital statistics and baseline population projection scenario 2021-2070.
Until 2035, the population is estimated to continue increasing by an average of 116,000 people per year, reaching 69.0 million inhabitants, based on a positive natural balance added to the positive net migration. The growth rate, of +0.2% per year, would be considerably lower than that seen over the last 50 years (+0.5% on average since 1970). As of 2035, deaths would outnumber births, resulting in a negative natural balance (Chart 2). Until 2044, the net migration would offset this natural deficit and the population would therefore continue to grow gently, reaching 69.3 million inhabitants. From 2044 onwards, this would no longer be the case and the population would fall at an average rate of 45,000 people (0.1%) per year, falling to 68.1 million inhabitants in 2070.
tableauChart 2 – Births, deaths and net migration from 1970 to 2070 (baseline scenario)
| Deaths | Births | Net migration | Natural balance | Population change1 | |
|---|---|---|---|---|---|
| 1970 | 542,000 | 850,000 | 180,000 | 308,000 | 488,000 |
| 1971 | 554,000 | 881,000 | 143,000 | 327,000 | 470,000 |
| 1972 | 550,000 | 878,000 | 102,000 | 328,000 | 430,000 |
| 1973 | 559,000 | 857,000 | 106,000 | 298,000 | 405,000 |
| 1974 | 553,000 | 801,000 | 31,000 | 249,000 | 279,000 |
| 1975 | 560,000 | 745,000 | 14,000 | 185,000 | 198,000 |
| 1976 | 557,000 | 720,000 | 57,000 | 163,000 | 221,000 |
| 1977 | 536,000 | 745,000 | 44,000 | 209,000 | 253,000 |
| 1978 | 547,000 | 737,000 | 19,000 | 190,000 | 210,000 |
| 1979 | 542,000 | 757,000 | 35,000 | 216,000 | 250,000 |
| 1980 | 547,000 | 800,000 | 44,000 | 253,000 | 297,000 |
| 1981 | 555,000 | 805,000 | 56,000 | 251,000 | 306,000 |
| 1982 | 543,000 | 797,000 | 61,000 | 254,000 | 315,000 |
| 1983 | 560,000 | 749,000 | 56,000 | 189,000 | 245,000 |
| 1984 | 542,000 | 760,000 | 45,000 | 217,000 | 262,000 |
| 1985 | 552,000 | 768,000 | 38,000 | 216,000 | 254,000 |
| 1986 | 547,000 | 778,000 | 39,000 | 232,000 | 271,000 |
| 1987 | 527,000 | 768,000 | 44,000 | 240,000 | 284,000 |
| 1988 | 525,000 | 771,000 | 57,000 | 247,000 | 304,000 |
| 1989 | 529,000 | 765,000 | 71,000 | 236,000 | 307,000 |
| 1990 | 526,000 | 762,000 | 80,000 | 236,000 | 316,000 |
| 1991 | 525,000 | 759,000 | 90,000 | 234,000 | 324,000 |
| 1992 | 522,000 | 744,000 | 90,000 | 222,000 | 312,000 |
| 1993 | 532,000 | 712,000 | 70,000 | 179,000 | 249,000 |
| 1994 | 520,000 | 711,000 | 50,000 | 191,000 | 241,000 |
| 1995 | 532,000 | 730,000 | 40,000 | 198,000 | 238,000 |
| 1996 | 536,000 | 734,000 | 35,000 | 199,000 | 234,000 |
| 1997 | 530,000 | 727,000 | 40,000 | 196,000 | 236,000 |
| 1998 | 534,000 | 738,000 | 45,000 | 204,000 | 249,000 |
| 1999 | 547,000 | 776,000 | 63,000 | 229,000 | 291,000 |
| 2000 | 541,000 | 807,000 | 72,000 | 267,000 | 339,000 |
| 2001 | 541,000 | 803,000 | 87,000 | 262,000 | 349,000 |
| 2002 | 545,000 | 793,000 | 97,000 | 248,000 | 345,000 |
| 2003 | 562,000 | 793,000 | 102,000 | 231,000 | 333,000 |
| 2004 | 519,000 | 799,000 | 105,000 | 280,000 | 385,000 |
| 2005 | 538,000 | 807,000 | 92,000 | 269,000 | 361,000 |
| 2006 | 527,000 | 829,000 | 112,000 | 302,000 | 415,000 |
| 2007 | 531,000 | 819,000 | 74,000 | 288,000 | 361,000 |
| 2008 | 543,000 | 828,000 | 57,000 | 286,000 | 343,000 |
| 2009 | 549,000 | 825,000 | 32,000 | 276,000 | 308,000 |
| 2010 | 551,000 | 833,000 | 39,000 | 282,000 | 320,000 |
| 2011 | 545,000 | 823,000 | 30,000 | 278,000 | 308,000 |
| 2012 | 570,000 | 821,000 | 72,000 | 251,000 | 324,000 |
| 2013 | 569,000 | 812,000 | 100,000 | 242,000 | 342,000 |
| 2014 | 559,000 | 819,000 | 32,000 | 259,000 | 292,000 |
| 2015 | 594,000 | 799,000 | 40,000 | 205,000 | 246,000 |
| 2016 | 594,000 | 784,000 | 65,000 | 190,000 | 255,000 |
| 2017 | 606,000 | 770,000 | 155,000 | 163,000 | 318,000 |
| 2018 | 610,000 | 759,000 | 87,000 | 149,000 | 236,000 |
| 2019 | 613,000 | 753,000 | 87,000 | 140,000 | 227,000 |
| 2020 | 669,000 | 736,000 | 87,000 | 67,000 | 154,000 |
| 2021 | 648,000 | 721,000 | 70,000 | 72,000 | 142,000 |
| 2022 | 627,000 | 718,000 | 70,000 | 91,000 | 161,000 |
| 2023 | 633,000 | 716,000 | 70,000 | 83,000 | 153,000 |
| 2024 | 639,000 | 713,000 | 70,000 | 73,000 | 143,000 |
| 2025 | 646,000 | 710,000 | 70,000 | 65,000 | 135,000 |
| 2026 | 652,000 | 709,000 | 70,000 | 57,000 | 127,000 |
| 2027 | 659,000 | 708,000 | 70,000 | 49,000 | 119,000 |
| 2028 | 665,000 | 707,000 | 70,000 | 42,000 | 112,000 |
| 2029 | 672,000 | 708,000 | 70,000 | 36,000 | 106,000 |
| 2030 | 680,000 | 709,000 | 70,000 | 29,000 | 99,000 |
| 2031 | 687,000 | 710,000 | 70,000 | 23,000 | 93,000 |
| 2032 | 696,000 | 712,000 | 70,000 | 16,000 | 86,000 |
| 2033 | 705,000 | 714,000 | 70,000 | 9,000 | 79,000 |
| 2034 | 714,000 | 716,000 | 70,000 | 2,000 | 72,000 |
| 2035 | 724,000 | 718,000 | 70,000 | –6,000 | 64,000 |
| 2036 | 734,000 | 720,000 | 70,000 | –14,000 | 56,000 |
| 2037 | 744,000 | 722,000 | 70,000 | –22,000 | 48,000 |
| 2038 | 754,000 | 724,000 | 70,000 | –30,000 | 40,000 |
| 2039 | 763,000 | 726,000 | 70,000 | –37,000 | 33,000 |
| 2040 | 772,000 | 727,000 | 70,000 | –45,000 | 25,000 |
| 2041 | 779,000 | 727,000 | 70,000 | –52,000 | 18,000 |
| 2042 | 785,000 | 726,000 | 70,000 | –59,000 | 11,000 |
| 2043 | 790,000 | 725,000 | 70,000 | –65,000 | 5,000 |
| 2044 | 793,000 | 723,000 | 70,000 | –70,000 | 0 |
| 2045 | 796,000 | 720,000 | 70,000 | –76,000 | –6,000 |
| 2046 | 797,000 | 717,000 | 70,000 | –81,000 | –11,000 |
| 2047 | 798,000 | 712,000 | 70,000 | –86,000 | –16,000 |
| 2048 | 798,000 | 707,000 | 70,000 | –91,000 | –21,000 |
| 2049 | 798,000 | 702,000 | 70,000 | –96,000 | –26,000 |
| 2050 | 798,000 | 697,000 | 70,000 | –101,000 | –31,000 |
| 2051 | 797,000 | 691,000 | 70,000 | –106,000 | –36,000 |
| 2052 | 797,000 | 685,000 | 70,000 | –112,000 | –42,000 |
| 2053 | 797,000 | 679,000 | 70,000 | –118,000 | –48,000 |
| 2054 | 797,000 | 674,000 | 70,000 | –123,000 | –53,000 |
| 2055 | 796,000 | 669,000 | 70,000 | –128,000 | –58,000 |
| 2056 | 796,000 | 664,000 | 70,000 | –132,000 | –62,000 |
| 2057 | 796,000 | 660,000 | 70,000 | –135,000 | –65,000 |
| 2058 | 795,000 | 658,000 | 70,000 | –137,000 | –67,000 |
| 2059 | 794,000 | 656,000 | 70,000 | –139,000 | –69,000 |
| 2060 | 793,000 | 654,000 | 70,000 | –139,000 | –69,000 |
| 2061 | 791,000 | 653,000 | 70,000 | –138,000 | –68,000 |
| 2062 | 790,000 | 653,000 | 70,000 | –136,000 | –66,000 |
| 2063 | 787,000 | 654,000 | 70,000 | –134,000 | –64,000 |
| 2064 | 785,000 | 654,000 | 70,000 | –131,000 | –61,000 |
| 2065 | 782,000 | 655,000 | 70,000 | –127,000 | –57,000 |
| 2066 | 779,000 | 656,000 | 70,000 | –123,000 | –53,000 |
| 2067 | 776,000 | 657,000 | 70,000 | –119,000 | –49,000 |
| 2068 | 773,000 | 658,000 | 70,000 | –115,000 | –45,000 |
| 2069 | 771,000 | 659,000 | 70,000 | –111,000 | –41,000 |
| 2070 | 768,000 | 660,000 | 70,000 | –108,000 | –38,000 |
- 1. Population change is the sum of the natural balance and net migration.
- Reading note: in France, according to the baseline scenario, there would be 768,000 deaths and 660,000 births in 2070, and net migration would be 70,000 people.
- Coverage: Metropolitan France for years up to 1998, France excluding Mayotte from 1999 to 2013, France from 2014 onwards.
- Source: INSEE, population estimates, vital statistics and baseline population projection scenario 2021-2070.
graphiqueChart 2 – Births, deaths and net migration from 1970 to 2070 (baseline scenario)

- 1. Population change is the sum of the natural balance and net migration.
- Reading note: in France, according to the baseline scenario, there would be 768,000 deaths and 660,000 births in 2070, and net migration would be 70,000 people.
- Coverage: Metropolitan France for years up to 1998, France excluding Mayotte from 1999 to 2013, France from 2014 onwards.
- Source: INSEE, population estimates, vital statistics and baseline population projection scenario 2021-2070.
Fertility and migration have the greatest impact on population change
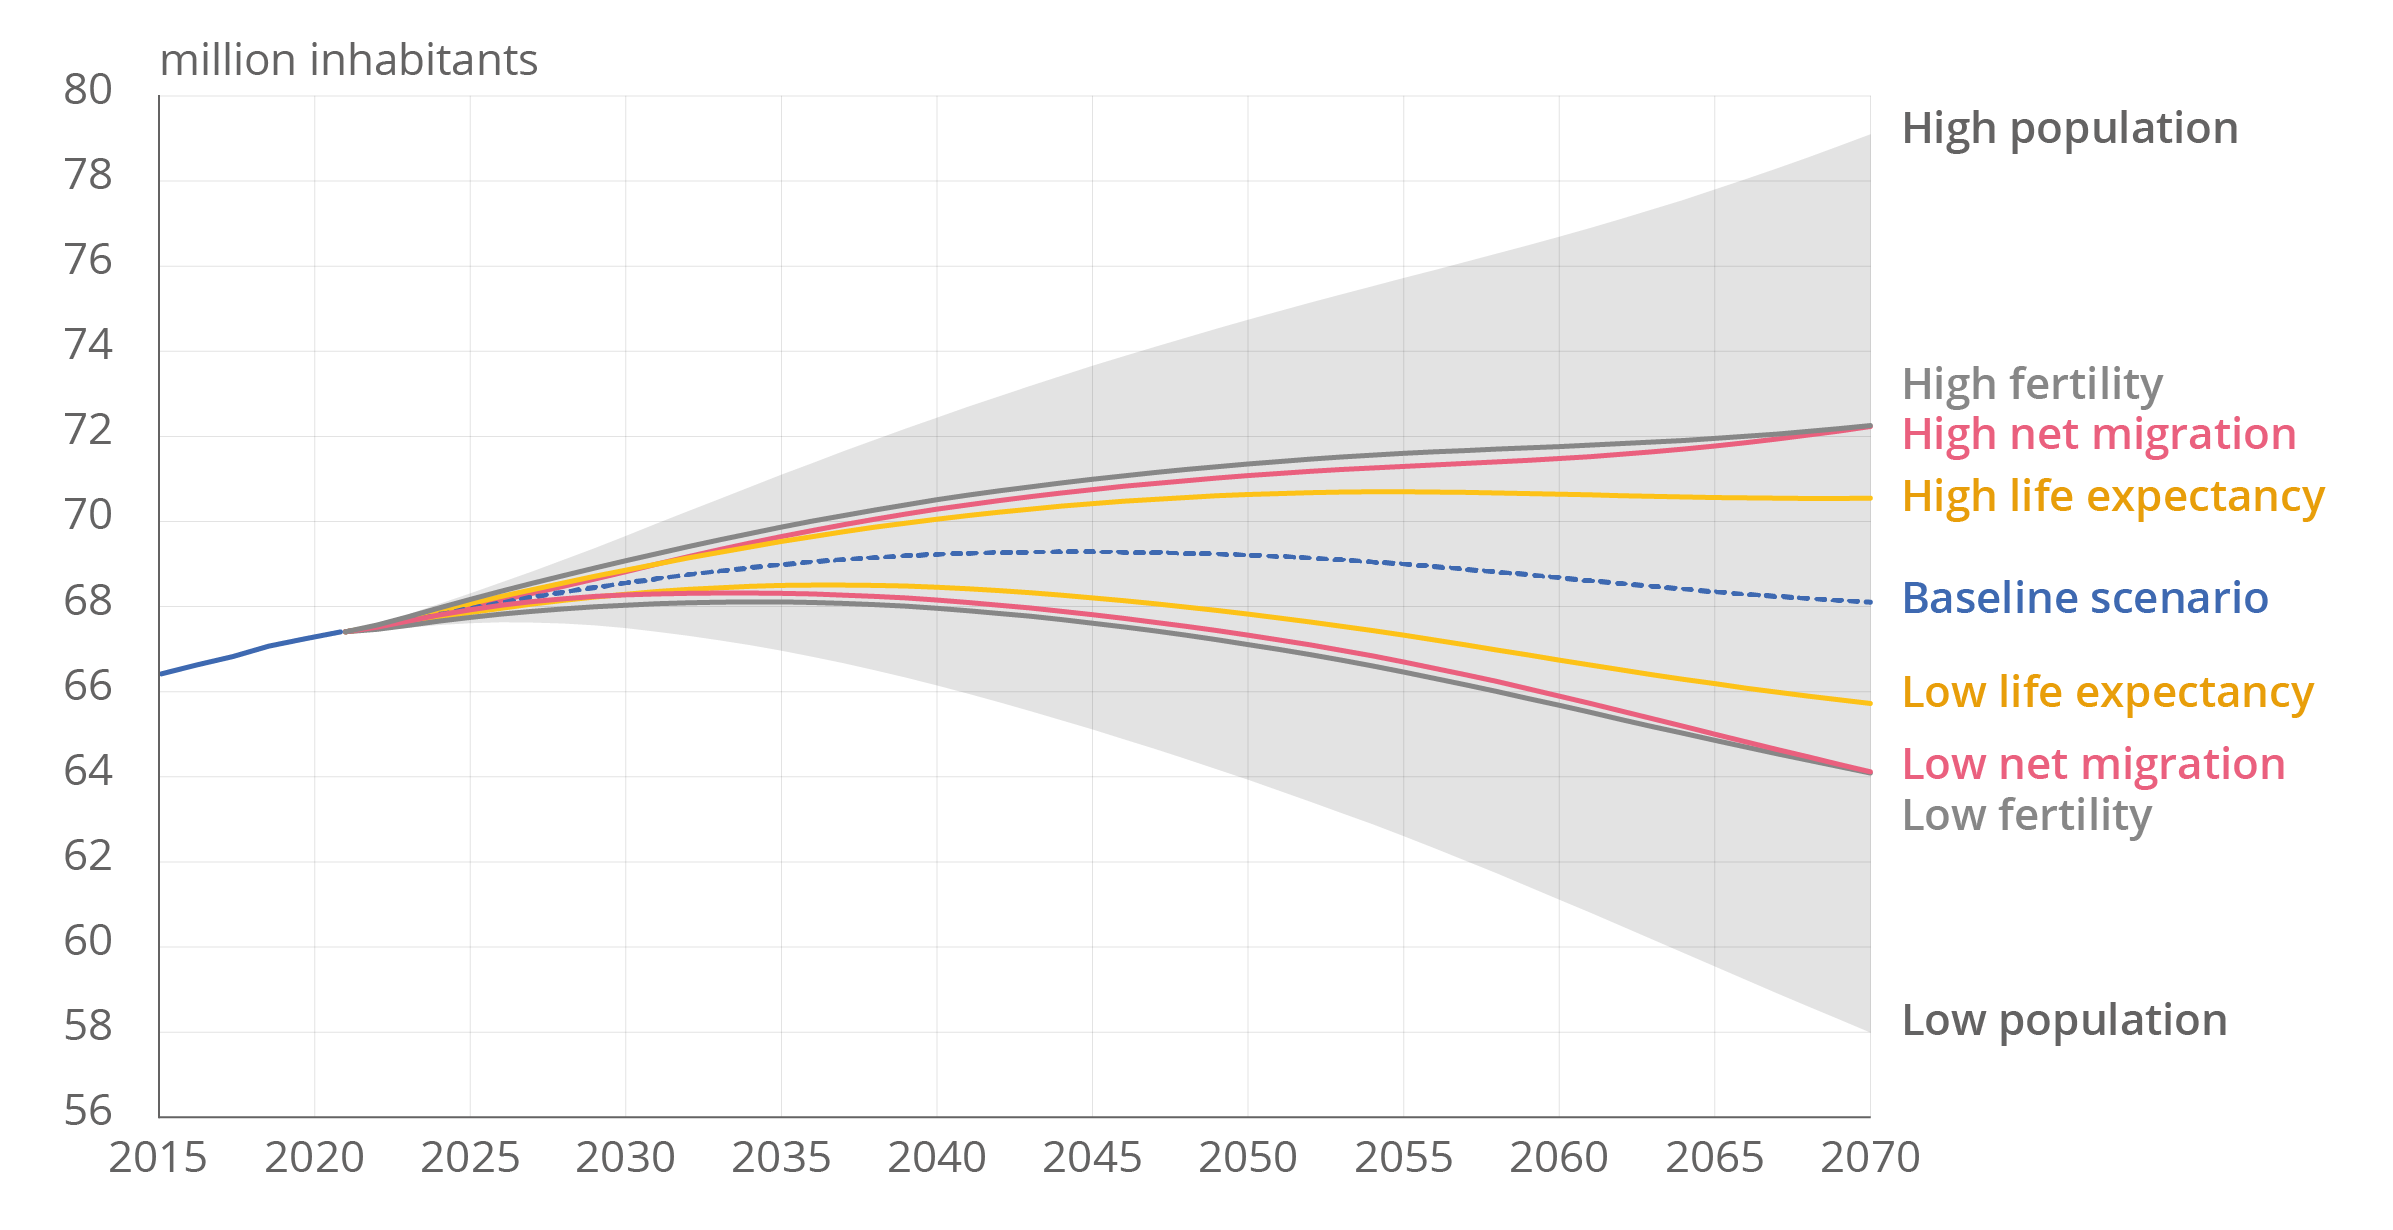
Births, deaths and migration are the three components of changes in the number of inhabitants from one year to the next. Several alternative scenarios to the baseline projection scenario have been considered: these equate to a change in the assumptions for fertility, mortality or migration and allows to measure the impact of these assumptions on future population change.
The change in the number of inhabitants in France between now and 2070 primarily depends on the assumptions for fertility and net migration. If the total fertility rate were to increase to 2.00 children per woman, the natural balance would remain positive until 2046 and, by 2070, France would have 4.1 million inhabitants more than estimated under the baseline scenario, in which the total fertility rate is stable at 1.80 children per woman (Chart 3). If the total fertility rate were to decrease to 1.60 children per woman, the natural balance would become negative from 2027 onwards, leading to 4.0 million fewer inhabitants in 2070. Assumptions on net migration create a similarly strong variation in the number of inhabitants between now and 2070. If the net migration in France were to exceed the baseline scenario by 50,000, i.e. positive net migration of 120,000 people per year, there would be an additional 4.1 million inhabitants in 2070. If it were to fall below the baseline scenario by 50,000 (net migration of +20,000 people per year), there would be 4.0 million fewer. Lastly, if, in 2070, life expectancy at birth was 3.5 years longer or shorter than that of the baseline scenario, there would be 2.4 million more or fewer inhabitants in 2070, respectively. If all the negative developments in population growth (lower fertility, life expectancy and net migration) were to combine (“low population” scenario), the population would fall from 2027 onwards and would be 58.0 million in 2070, i.e. the same level as in 1990. Inversely, if all the positive developments were to combine (“high population” scenario), the population would increase at a steady rate throughout the period and would reach 79.1 million by 2070.
tableauChart 3 - Population from now to 2070 according to the scenarios
| Baseline scenario | Low fertility | High fertility | Low life expectancy | High life expectancy | Low net migration | High net migration | Low population | High population | |
|---|---|---|---|---|---|---|---|---|---|
| 2021 | 67.4 | 67.4 | 67.4 | 67.4 | 67.4 | 67.4 | 67.4 | 67.4 | 67.4 |
| 2022 | 67.5 | 67.5 | 67.5 | 67.5 | 67.5 | 67.5 | 67.6 | 67.4 | 67.6 |
| 2023 | 67.7 | 67.7 | 67.7 | 67.6 | 67.7 | 67.6 | 67.8 | 67.5 | 67.8 |
| 2024 | 67.8 | 67.8 | 67.8 | 67.7 | 67.9 | 67.7 | 68.0 | 67.6 | 68.1 |
| 2025 | 68.0 | 67.9 | 68.0 | 67.9 | 68.1 | 67.7 | 68.2 | 67.6 | 68.3 |
| 2026 | 68.1 | 68.0 | 68.1 | 68.0 | 68.2 | 67.8 | 68.4 | 67.6 | 68.6 |
| 2027 | 68.2 | 68.1 | 68.3 | 68.1 | 68.4 | 67.9 | 68.5 | 67.6 | 68.8 |
| 2028 | 68.3 | 68.2 | 68.5 | 68.1 | 68.6 | 67.9 | 68.7 | 67.6 | 69.1 |
| 2029 | 68.4 | 68.2 | 68.6 | 68.2 | 68.7 | 68.0 | 68.9 | 67.6 | 69,4 |
| 2030 | 68.6 | 68.3 | 68.8 | 68.3 | 68.9 | 68.0 | 69.1 | 67.5 | 69.7 |
| 2031 | 68.7 | 68.3 | 69.0 | 68.4 | 69.0 | 68.1 | 69.2 | 67.4 | 69.9 |
| 2032 | 68.7 | 68.3 | 69.2 | 68.4 | 69.1 | 68.1 | 69.4 | 67.3 | 70.2 |
| 2033 | 68.8 | 68.3 | 69.3 | 68.4 | 69.3 | 68.1 | 69.6 | 67.2 | 70.5 |
| 2034 | 68.9 | 68.3 | 69.5 | 68.5 | 69,4 | 68.1 | 69.7 | 67.1 | 70.8 |
| 2035 | 69.0 | 68.3 | 69.6 | 68.5 | 69.5 | 68.1 | 69.9 | 67.0 | 71.1 |
| 2036 | 69.0 | 68.3 | 69.8 | 68.5 | 69.6 | 68.1 | 70.0 | 66.8 | 71.4 |
| 2037 | 69.1 | 68.3 | 69.9 | 68.5 | 69.8 | 68.1 | 70.1 | 66.7 | 71.6 |
| 2038 | 69.2 | 68.2 | 70.1 | 68.5 | 69.9 | 68.0 | 70.3 | 66.5 | 71.9 |
| 2039 | 69.2 | 68.2 | 70.2 | 68.5 | 70.0 | 68.0 | 70.4 | 66.3 | 72.2 |
| 2040 | 69.2 | 68.2 | 70.3 | 68.5 | 70.1 | 68.0 | 70.5 | 66.2 | 72.4 |
| 2041 | 69.3 | 68.1 | 70.4 | 68.4 | 70.1 | 67.9 | 70.6 | 66.0 | 72.7 |
| 2042 | 69.3 | 68.0 | 70.5 | 68.4 | 70.2 | 67.8 | 70.7 | 65.8 | 72.9 |
| 2043 | 69.3 | 68.0 | 70.6 | 68.3 | 70.3 | 67.8 | 70.8 | 65.6 | 73.2 |
| 2044 | 69.3 | 67.9 | 70.7 | 68.3 | 70.4 | 67.7 | 70.9 | 65.3 | 73.4 |
| 2045 | 69.3 | 67.8 | 70.7 | 68.2 | 70.4 | 67.6 | 71.0 | 65.1 | 73.7 |
| 2046 | 69.3 | 67.7 | 70.8 | 68.1 | 70.5 | 67.5 | 71.1 | 64.9 | 73.9 |
| 2047 | 69.3 | 67.6 | 70.9 | 68.1 | 70.5 | 67.4 | 71.1 | 64.7 | 74.1 |
| 2048 | 69.3 | 67.5 | 71.0 | 68.0 | 70.6 | 67.3 | 71.2 | 64.4 | 74.3 |
| 2049 | 69.2 | 67.4 | 71.0 | 67.9 | 70.6 | 67.2 | 71.3 | 64.2 | 74.5 |
| 2050 | 69.2 | 67.3 | 71.1 | 67.8 | 70.6 | 67.1 | 71.4 | 63.9 | 74.7 |
| 2051 | 69.2 | 67.2 | 71.1 | 67.7 | 70.7 | 67.0 | 71.4 | 63.7 | 74.9 |
| 2052 | 69.1 | 67.1 | 71.2 | 67.6 | 70.7 | 66.9 | 71.5 | 63.4 | 75.1 |
| 2053 | 69.1 | 67.0 | 71.2 | 67.5 | 70.7 | 66.7 | 71.5 | 63.2 | 75.3 |
| 2054 | 69.1 | 66.8 | 71.3 | 67.4 | 70.7 | 66.6 | 71.6 | 62.9 | 75.5 |
| 2055 | 69.0 | 66.7 | 71.3 | 67.3 | 70.7 | 66.5 | 71.6 | 62.6 | 75.7 |
| 2056 | 68.9 | 66.6 | 71.3 | 67.2 | 70.7 | 66.3 | 71.6 | 62.3 | 75.9 |
| 2057 | 68.9 | 66.4 | 71.4 | 67.1 | 70.7 | 66.2 | 71.7 | 62.0 | 76.1 |
| 2058 | 68.8 | 66.2 | 71.4 | 67.0 | 70.7 | 66.0 | 71.7 | 61.7 | 76.3 |
| 2059 | 68.7 | 66.1 | 71.4 | 66.9 | 70.7 | 65.8 | 71.7 | 61.4 | 76.5 |
| 2060 | 68.7 | 65.9 | 71.5 | 66.7 | 70.6 | 65.7 | 71.8 | 61.1 | 76.7 |
| 2061 | 68.6 | 65.7 | 71.5 | 66.6 | 70.6 | 65.5 | 71.8 | 60.8 | 76.9 |
| 2062 | 68.5 | 65.5 | 71.6 | 66.5 | 70.6 | 65.3 | 71.8 | 60.5 | 77.1 |
| 2063 | 68.5 | 65.4 | 71.6 | 66.4 | 70.6 | 65.2 | 71.9 | 60.2 | 77.3 |
| 2064 | 68.4 | 65.2 | 71.7 | 66.3 | 70.6 | 65.0 | 71.9 | 59.9 | 77.6 |
| 2065 | 68.3 | 65.0 | 71.8 | 66.2 | 70.6 | 64.9 | 72.0 | 59.5 | 77.8 |
| 2066 | 68.3 | 64.8 | 71.8 | 66.1 | 70.6 | 64.7 | 72.0 | 59.2 | 78.0 |
| 2067 | 68.2 | 64.6 | 71.9 | 66.0 | 70.5 | 64.5 | 72.1 | 58.9 | 78.3 |
| 2068 | 68.2 | 64.5 | 72.0 | 65.9 | 70.5 | 64.4 | 72.1 | 58.6 | 78.6 |
| 2069 | 68.1 | 64.3 | 72.1 | 65.8 | 70.5 | 64.2 | 72.2 | 58.3 | 78.8 |
| 2070 | 68.1 | 64.1 | 72.2 | 65.7 | 70.5 | 64.1 | 72.3 | 58.0 | 79.1 |
- Reading note: on 1 January 2070, there would be 68.1 million inhabitants in France under the baseline scenario, and 58.0 million under the low population scenario.
- Coverage: France.
- Source: INSEE, population estimates and baseline population projection scenario 2021-2070.
graphiqueChart 3 - Population from now to 2070 according to the scenarios
- Reading note: on 1 January 2070, there would be 68.1 million inhabitants in France under the baseline scenario, and 58.0 million under the low population scenario.
- Coverage: France.
- Source: INSEE, population estimates and baseline population projection scenario 2021-2070.
By 2070: +5.7 million people aged 75 or over, –5.0 million under 60s
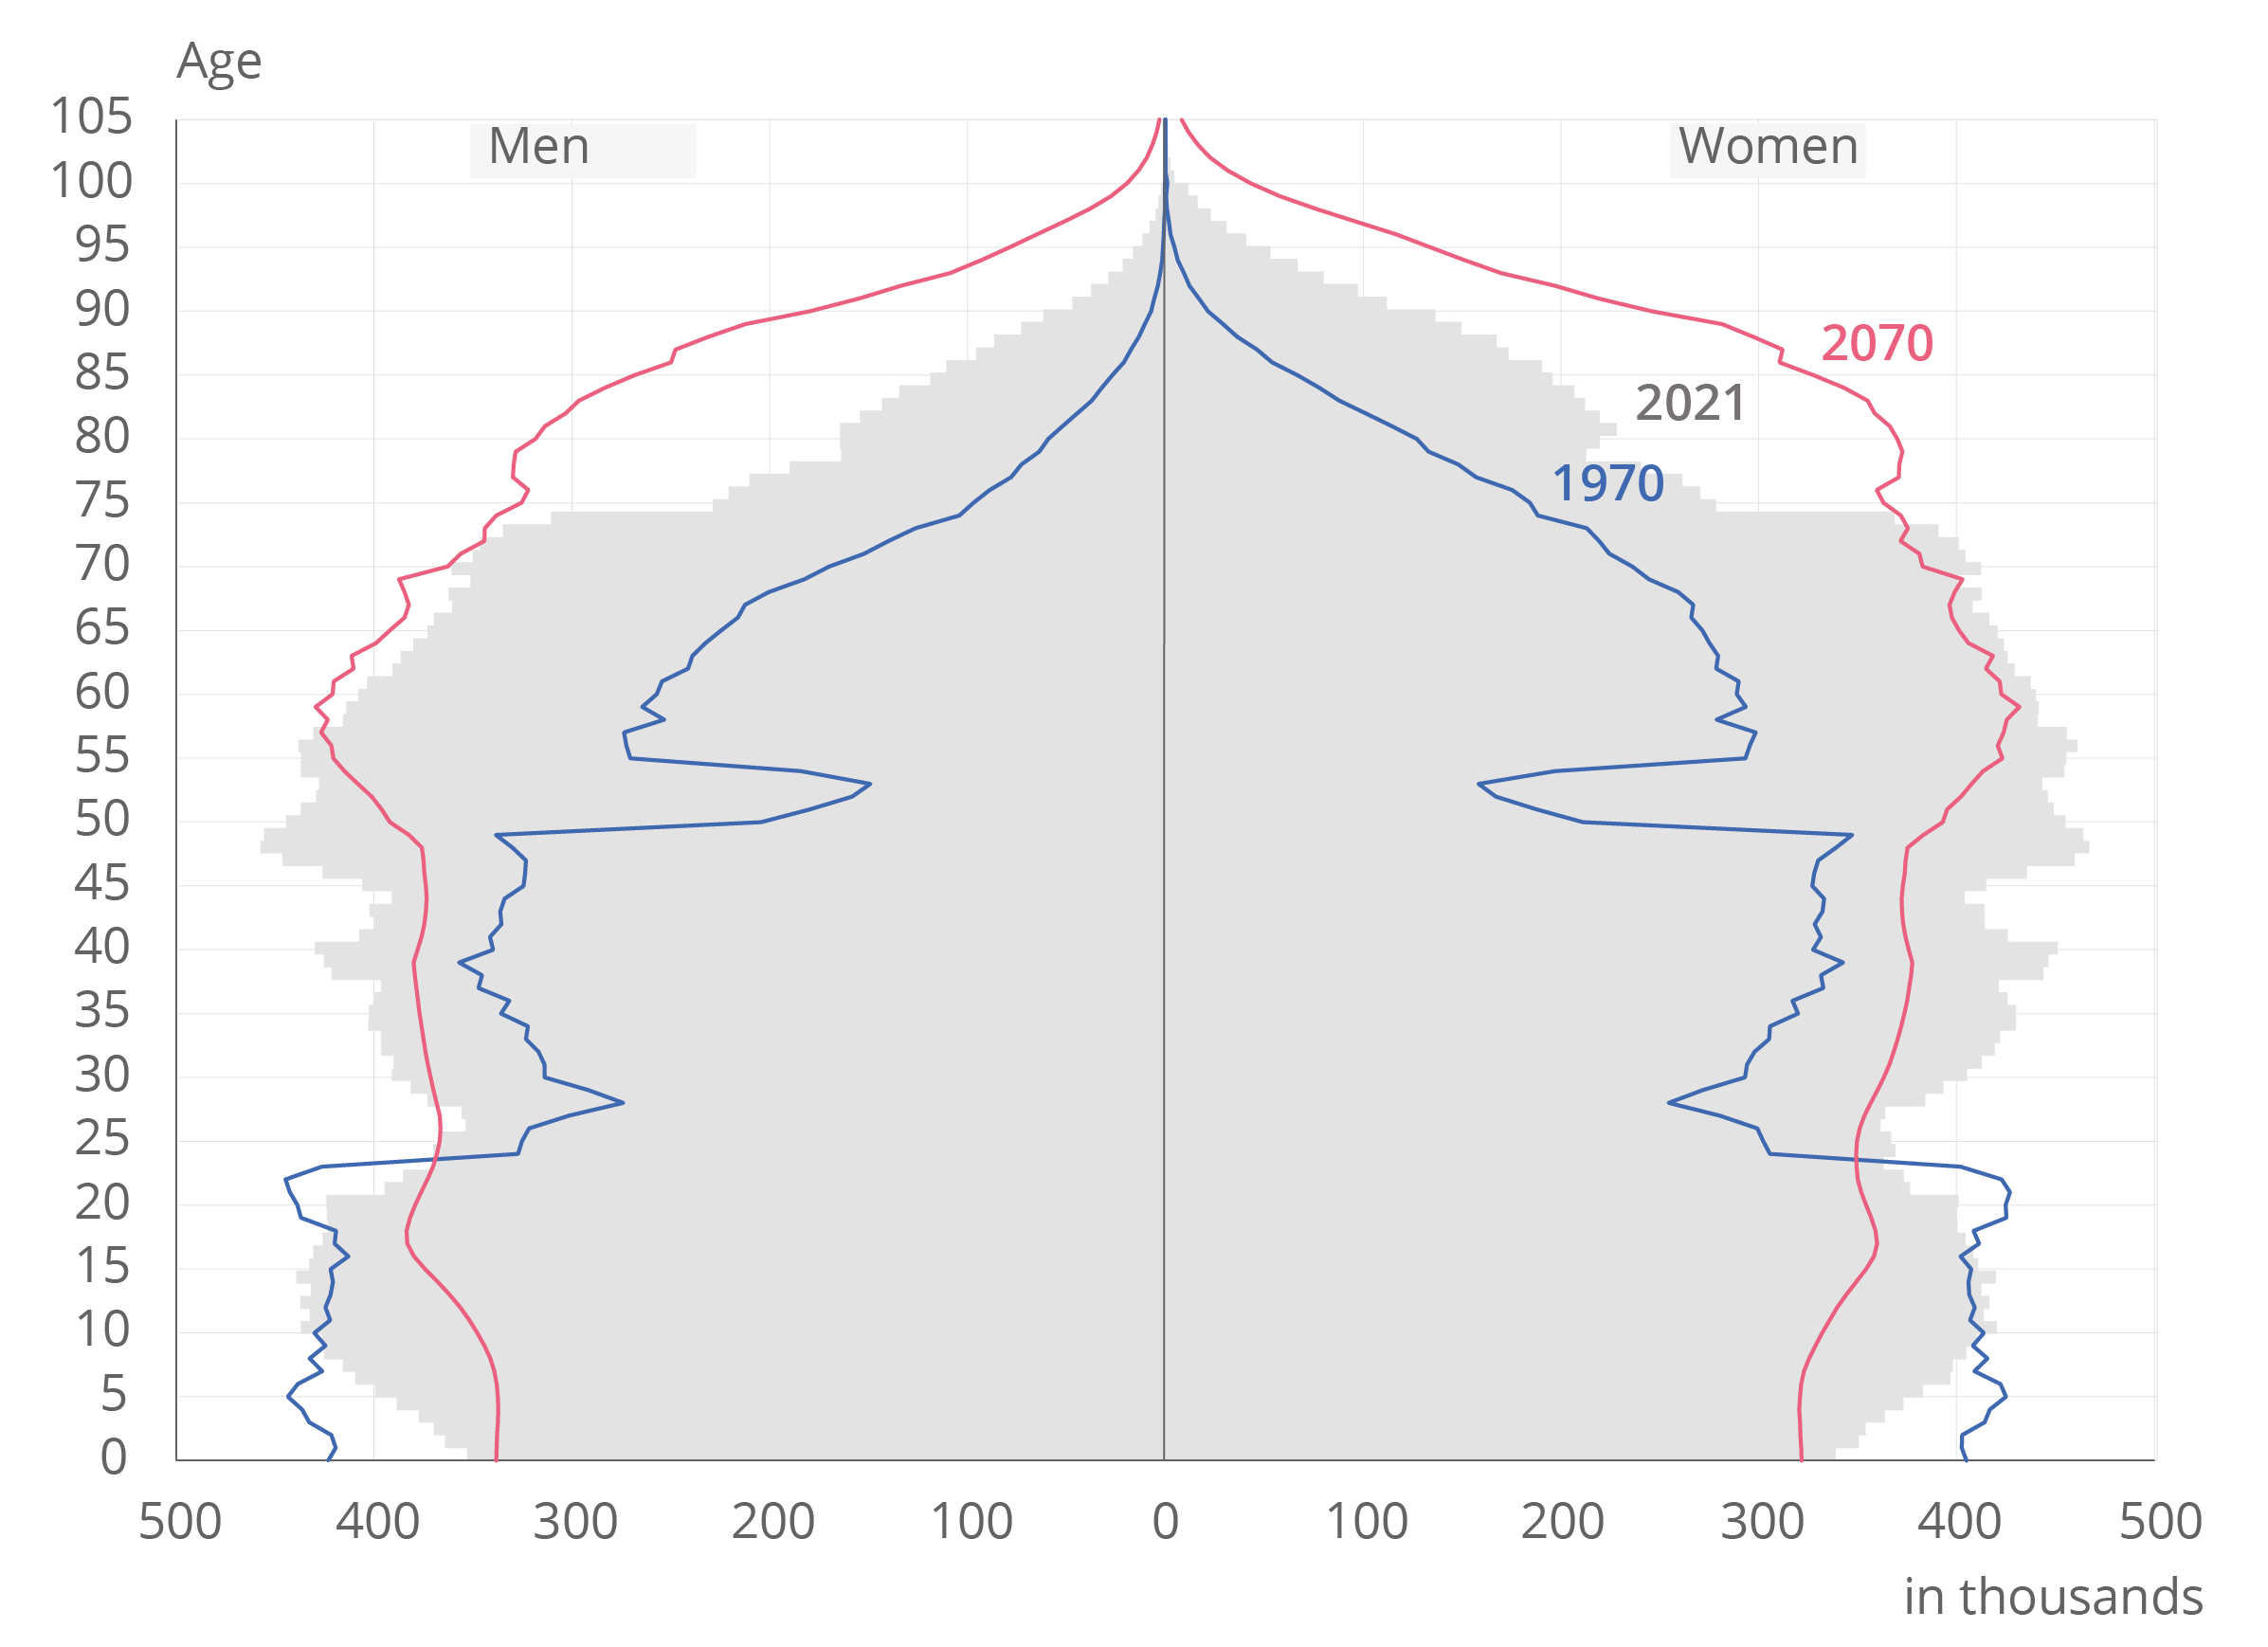
Under the baseline scenario, the number of inhabitants in 2070 would be relatively similar to that of 2021 (68.1 million compared with 67.4 million), but the age structure would be very different (Chart 4). The number of inhabitants aged 75 or over would increase by 5.7 million over this period, while the number of under 60s would fall by almost the same amount (–5.0 million). The number of people aged between 60 and 74 would remain stable. Under this scenario, the population in France would thus be ageing, due to the combined effect of the rise in the number of older people and the fall in the number of children and adults under 60. The widening of the top of the age pyramid is explained by several factors. First, with the rise in life expectancy that has already taken place, and even if it were not to increase any further, there would be a greater number of older people in 2070. Secondly, the rise in future life expectancy, if the trends were to continue, would also lead to an increase in the number of people reaching an advanced age. Lastly, almost all people aged 75 or over in 2070, born in or before 1995, belong to larger generations than those of the same age in 2021 (born before 1946 and therefore before the baby boom). The number of people aged 60-74 would be similar in 2021 and 2070, as the rise in life expectancy would offset the smaller size of these generations. Lastly, the narrowing of the middle and bottom of the pyramid would be due to the replacement of the last generations of the baby boom, born before 1975 and aged 46 to 59 on 1 January 2021, by the smaller generations born in the 2010s. What is more, the generations born from 2021 onwards, who will be under 49 in 2070, will be smaller as, under the baseline scenario, the total fertility rate would be 1.8 children per woman, which is, more often than not, lower than its past level.
tableauChart 4 – Population by gender and age in 1970, 2021 and 2070
| Age | Men | Women | ||||
|---|---|---|---|---|---|---|
| 1970 | 2021 | 2070 | 1970 | 2021 | 2070 | |
| 0 | 423,200 | 352,800 | 338,200 | 405,000 | 338,900 | 321,700 |
| 1 | 419,400 | 364,000 | 337,900 | 402,600 | 350,600 | 321,400 |
| 2 | 421,600 | 369,600 | 337,700 | 402,900 | 354,000 | 321,100 |
| 3 | 432,800 | 377,300 | 337,400 | 414,200 | 363,800 | 320,800 |
| 4 | 436,300 | 388,500 | 337,200 | 416,900 | 373,100 | 320,500 |
| 5 | 443,600 | 399,500 | 337,400 | 425,000 | 382,900 | 320,800 |
| 6 | 438,500 | 409,400 | 338,000 | 422,200 | 396,900 | 321,500 |
| 7 | 426,200 | 415,700 | 339,200 | 409,100 | 398,100 | 322,900 |
| 8 | 432,600 | 425,300 | 341,200 | 415,600 | 405,000 | 325,400 |
| 9 | 424,500 | 426,300 | 344,200 | 408,300 | 410,300 | 328,600 |
| 10 | 430,100 | 437,000 | 347,800 | 413,800 | 420,400 | 332,100 |
| 11 | 422,100 | 432,400 | 351,800 | 406,800 | 413,700 | 335,800 |
| 12 | 424,600 | 437,200 | 356,300 | 409,300 | 416,500 | 339,700 |
| 13 | 421,900 | 431,900 | 361,700 | 406,400 | 412,600 | 344,300 |
| 14 | 420,700 | 439,200 | 367,700 | 406,000 | 420,000 | 349,300 |
| 15 | 421,900 | 432,700 | 374,200 | 407,500 | 411,000 | 354,300 |
| 16 | 413,000 | 430,700 | 379,800 | 402,000 | 408,400 | 358,200 |
| 17 | 420,000 | 425,900 | 383,100 | 411,500 | 404,600 | 359,800 |
| 18 | 419,100 | 423,200 | 383,600 | 408,700 | 400,600 | 359,000 |
| 19 | 437,000 | 423,900 | 381,800 | 425,300 | 400,100 | 356,800 |
| 20 | 438,700 | 424,100 | 379,200 | 424,800 | 401,000 | 354,300 |
| 21 | 442,500 | 394,600 | 376,100 | 427,100 | 376,600 | 351,900 |
| 22 | 444,800 | 385,200 | 373,000 | 422,800 | 373,400 | 350,100 |
| 23 | 426,300 | 369,700 | 370,200 | 402,100 | 363,200 | 349,400 |
| 24 | 327,300 | 370,000 | 368,100 | 305,600 | 369,200 | 349,200 |
| 25 | 325,200 | 365,500 | 366,700 | 302,300 | 367,000 | 349,700 |
| 26 | 321,600 | 353,600 | 366,300 | 299,200 | 361,500 | 351,000 |
| 27 | 301,400 | 355,700 | 366,800 | 280,200 | 363,900 | 353,400 |
| 28 | 274,100 | 372,800 | 368,300 | 254,500 | 384,100 | 356,600 |
| 29 | 291,600 | 381,500 | 369,900 | 271,600 | 393,400 | 360,100 |
| 30 | 313,800 | 391,000 | 371,400 | 293,100 | 405,300 | 363,300 |
| 31 | 313,800 | 390,100 | 372,800 | 294,000 | 412,700 | 366,100 |
| 32 | 316,900 | 396,300 | 374,000 | 297,800 | 419,400 | 368,300 |
| 33 | 323,200 | 396,500 | 375,000 | 305,200 | 421,900 | 370,200 |
| 34 | 322,200 | 402,800 | 375,900 | 305,700 | 430,200 | 372,000 |
| 35 | 335,800 | 402,400 | 376,900 | 319,800 | 430,100 | 373,600 |
| 36 | 331,600 | 400,300 | 377,800 | 317,000 | 425,700 | 375,000 |
| 37 | 347,100 | 396,500 | 378,600 | 332,600 | 421,300 | 376,100 |
| 38 | 345,400 | 421,500 | 379,400 | 331,400 | 443,900 | 377,000 |
| 39 | 357,000 | 425,300 | 380,000 | 342,700 | 446,600 | 377,700 |
| 40 | 339,700 | 429,900 | 377,900 | 327,400 | 451,200 | 375,800 |
| 41 | 341,400 | 407,500 | 376,000 | 331,400 | 425,900 | 374,300 |
| 42 | 335,600 | 399,700 | 374,600 | 328,200 | 414,100 | 373,100 |
| 43 | 336,200 | 402,200 | 373,700 | 332,200 | 414,200 | 372,400 |
| 44 | 333,900 | 391,100 | 373,400 | 333,000 | 404,200 | 372,300 |
| 45 | 324,500 | 405,800 | 373,800 | 327,000 | 415,000 | 372,900 |
| 46 | 323,700 | 426,100 | 374,500 | 328,100 | 435,600 | 373,900 |
| 47 | 323,300 | 446,300 | 375,000 | 330,100 | 459,800 | 374,300 |
| 48 | 330,000 | 457,400 | 375,800 | 339,100 | 467,000 | 375,200 |
| 49 | 338,300 | 455,700 | 382,400 | 347,200 | 464,200 | 383,200 |
| 50 | 204,300 | 444,500 | 392,000 | 211,100 | 455,100 | 393,100 |
| 51 | 179,700 | 437,100 | 396,200 | 187,700 | 449,200 | 395,200 |
| 52 | 158,200 | 429,200 | 401,100 | 167,200 | 446,200 | 402,300 |
| 53 | 149,000 | 427,900 | 408,200 | 158,300 | 443,400 | 407,600 |
| 54 | 184,200 | 436,900 | 414,900 | 197,200 | 454,600 | 413,400 |
| 55 | 270,500 | 436,800 | 420,600 | 293,300 | 455,600 | 423,200 |
| 56 | 272,500 | 438,200 | 421,600 | 295,400 | 461,200 | 420,800 |
| 57 | 273,600 | 430,600 | 426,700 | 298,400 | 455,700 | 423,900 |
| 58 | 253,300 | 415,600 | 423,400 | 278,600 | 441,000 | 425,400 |
| 59 | 264,400 | 414,000 | 429,500 | 293,500 | 441,500 | 431,900 |
| 60 | 257,000 | 407,800 | 420,900 | 288,900 | 440,200 | 422,600 |
| 61 | 254,500 | 403,400 | 420,400 | 289,800 | 437,600 | 421,900 |
| 62 | 241,300 | 390,700 | 410,300 | 278,500 | 429,400 | 414,900 |
| 63 | 239,000 | 386,500 | 411,300 | 279,500 | 426,000 | 418,400 |
| 64 | 232,400 | 380,000 | 398,900 | 275,100 | 424,000 | 406,100 |
| 65 | 224,400 | 372,800 | 391,900 | 271,500 | 420,800 | 401,200 |
| 66 | 216,000 | 369,700 | 384,500 | 265,900 | 416,500 | 397,700 |
| 67 | 212,400 | 360,400 | 382,300 | 266,900 | 408,100 | 396,500 |
| 68 | 200,400 | 362,300 | 384,500 | 259,400 | 412,800 | 399,100 |
| 69 | 182,400 | 351,300 | 387,400 | 244,500 | 400,500 | 403,000 |
| 70 | 169,900 | 360,800 | 362,700 | 236,100 | 412,400 | 382,800 |
| 71 | 152,300 | 350,000 | 356,200 | 224,500 | 404,600 | 381,200 |
| 72 | 139,800 | 346,200 | 344,100 | 219,400 | 401,100 | 371,600 |
| 73 | 126,400 | 334,900 | 343,900 | 213,100 | 391,000 | 375,500 |
| 74 | 104,200 | 310,600 | 338,100 | 188,400 | 368,700 | 371,800 |
| 75 | 96,900 | 228,700 | 325,500 | 184,400 | 278,400 | 363,000 |
| 76 | 88,800 | 220,700 | 322,100 | 175,400 | 270,300 | 359,700 |
| 77 | 78,000 | 210,200 | 329,800 | 157,200 | 261,400 | 370,900 |
| 78 | 72,800 | 189,900 | 329,400 | 148,200 | 240,700 | 371,000 |
| 79 | 63,800 | 163,800 | 328,400 | 133,100 | 212,900 | 372,600 |
| 80 | 59,200 | 164,300 | 318,500 | 127,100 | 219,700 | 370,100 |
| 81 | 52,000 | 164,400 | 313,600 | 114,500 | 228,200 | 366,300 |
| 82 | 44,600 | 154,400 | 303,200 | 101,400 | 219,600 | 358,600 |
| 83 | 37,200 | 143,100 | 296,400 | 87,900 | 212,200 | 355,000 |
| 84 | 32,200 | 134,300 | 283,500 | 78,000 | 206,900 | 343,300 |
| 85 | 26,800 | 118,900 | 268,200 | 66,700 | 195,900 | 327,600 |
| 86 | 20,900 | 110,700 | 249,900 | 54,000 | 190,400 | 310,400 |
| 87 | 17,400 | 95,700 | 247,700 | 46,400 | 173,400 | 312,000 |
| 88 | 13,300 | 86,400 | 231,100 | 36,400 | 167,500 | 297,300 |
| 89 | 10,300 | 72,800 | 212,300 | 29,200 | 149,600 | 281,500 |
| 90 | 7,200 | 61,600 | 179,800 | 21,700 | 136,500 | 246,200 |
| 91 | 5,500 | 46,900 | 154,900 | 17,000 | 111,800 | 219,200 |
| 92 | 3,700 | 37,500 | 133,600 | 12,300 | 97,300 | 197,100 |
| 93 | 2,500 | 28,800 | 108,700 | 9,400 | 80,000 | 169,800 |
| 94 | 1,600 | 21,500 | 92,700 | 6,200 | 66,800 | 150,900 |
| 95 | 1,200 | 16,300 | 78,500 | 4,700 | 53,100 | 133,700 |
| 96 | 700 | 11,500 | 64,900 | 2,700 | 40,900 | 116,700 |
| 97 | 500 | 7,800 | 51,100 | 1,800 | 31,000 | 96,300 |
| 98 | 200 | 4,900 | 38,200 | 900 | 23,000 | 76,200 |
| 99 | 100 | 3,500 | 27,300 | 500 | 16,400 | 57,900 |
| 100 | 100 | 2,100 | 19,400 | 1,000 | 11,500 | 43,300 |
| 101 | 0 | 800 | 13,500 | 0 | 4,500 | 31,700 |
| 102 | 0 | 500 | 9,400 | 0 | 2,600 | 22,900 |
| 103 | 0 | 300 | 6,600 | 0 | 1,600 | 16,700 |
| 104 | 0 | 100 | 4,400 | 0 | 900 | 11,900 |
| 105 | 0 | 100 | 2,900 | 0 | 600 | 8,300 |
| 106 or over | 0 | 400 | 4,600 | 0 | 1,400 | 15,800 |
| Total | 24,655,500 | 32,560,300 | 33,522,000 | 25,872,700 | 34,846,900 | 34,581,700 |
- Reading note: on 1 January 2070, according to the baseline scenario, there would be 403,000 women aged 69 in France.
- Coverage: Metropolitan France in 1970, France in 2021 and 2070.
- Source: INSEE, population estimates and baseline population projection scenario 2021-2070.
graphiqueChart 4 – Population by gender and age in 1970, 2021 and 2070
- Reading note: on 1 January 2070, according to the baseline scenario, there would be 403,000 women aged 69 in France.
- Coverage: Metropolitan France in 1970, France in 2021 and 2070.
- Source: INSEE, population estimates and baseline population projection scenario 2021-2070.
The age pyramid in 2070 would also be more balanced between men and women: 50.8% women compared with 51.7% in 2021. This re-balancing would occur in particular at ages with high mortality rates. Therefore, the proportion of women among 85 and overs would fall from 68% to 59%. Likewise, the proportion of women among centenarians would drop from 84% to 71%. Indeed, under the assumptions used, the differences in life expectancy between men and women would continue to narrow, as they did between 2010 and 2019, as women gained 0.9 years of life expectancy and men gained 1.7 years.
Between now and 2040, the proportion of 65 and overs would increase at the same rate as in the past
Between now and 2040, the proportion of 65 and overs would increase strongly, driven mainly by the increase in the number of 75 and overs, from 21% to 26%, a rise of 5 points (Chart 5). It would therefore grow at the same rate as it did from 2002 to 2021, a period of the same length (from 16% to 21%). Indeed, one sub-section of the baby boom generation, those aged 65 to 74, had already moved into the senior citizen bracket before 2021.
tableauChart 5a - Population structure by age from 1970 to 2070 under various scenarios
| Baseline scenario | Young population | Aged population | |||||||
|---|---|---|---|---|---|---|---|---|---|
| 0-19 years | 20-64 years | 65 years or over | 0-19 years | 20-64 years | 65 years or over | 0-19 years | 20-64 years | 65 years or over | |
| 1970 | 33.1 | 54.0 | 12.8 | 33.1 | 54.0 | 12.8 | 33.1 | 54.0 | 12.8 |
| 1971 | 32.9 | 54.2 | 12.9 | 32.9 | 54.2 | 12.9 | 32.9 | 54.2 | 12.9 |
| 1972 | 32.7 | 54.2 | 13.0 | 32.7 | 54.2 | 13.0 | 32.7 | 54.2 | 13.0 |
| 1973 | 32.6 | 54.3 | 13.1 | 32.6 | 54.3 | 13.1 | 32.6 | 54.3 | 13.1 |
| 1974 | 32.4 | 54.4 | 13.3 | 32.4 | 54.4 | 13.3 | 32.4 | 54.4 | 13.3 |
| 1975 | 32.1 | 54.5 | 13.4 | 32.1 | 54.5 | 13.4 | 32.1 | 54.5 | 13.4 |
| 1976 | 31.8 | 54.6 | 13.5 | 31.8 | 54.6 | 13.5 | 31.8 | 54.6 | 13.5 |
| 1977 | 31.5 | 54.9 | 13.6 | 31.5 | 54.9 | 13.6 | 31.5 | 54.9 | 13.6 |
| 1978 | 31.2 | 55.0 | 13.8 | 31.2 | 55.0 | 13.8 | 31.2 | 55.0 | 13.8 |
| 1979 | 30.9 | 55.2 | 13.9 | 30.9 | 55.2 | 13.9 | 30.9 | 55.2 | 13.9 |
| 1980 | 30.6 | 55.4 | 14.0 | 30.6 | 55.4 | 14.0 | 30.6 | 55.4 | 14.0 |
| 1981 | 30.3 | 55.9 | 13.8 | 30.3 | 55.9 | 13.8 | 30.3 | 55.9 | 13.8 |
| 1982 | 30.0 | 56.5 | 13.5 | 30.0 | 56.5 | 13.5 | 30.0 | 56.5 | 13.5 |
| 1983 | 29.8 | 57.0 | 13.2 | 29.8 | 57.0 | 13.2 | 29.8 | 57.0 | 13.2 |
| 1984 | 29.5 | 57.6 | 12.9 | 29.5 | 57.6 | 12.9 | 29.5 | 57.6 | 12.9 |
| 1985 | 29.2 | 58.0 | 12.8 | 29.2 | 58.0 | 12.8 | 29.2 | 58.0 | 12.8 |
| 1986 | 28.9 | 58.1 | 13.0 | 28.9 | 58.1 | 13.0 | 28.9 | 58.1 | 13.0 |
| 1987 | 28.6 | 58.1 | 13.3 | 28.6 | 58.1 | 13.3 | 28.6 | 58.1 | 13.3 |
| 1988 | 28.3 | 58.2 | 13.5 | 28.3 | 58.2 | 13.5 | 28.3 | 58.2 | 13.5 |
| 1989 | 28.1 | 58.2 | 13.7 | 28.1 | 58.2 | 13.7 | 28.1 | 58.2 | 13.7 |
| 1990 | 27.8 | 58.3 | 13.9 | 27.8 | 58.3 | 13.9 | 27.8 | 58.3 | 13.9 |
| 1991 | 27.7 | 58.3 | 14.0 | 27,7 | 58.3 | 14.0 | 27.7 | 58.3 | 14.0 |
| 1992 | 27.4 | 58.4 | 14.2 | 27.4 | 58.4 | 14.2 | 27.4 | 58.4 | 14.2 |
| 1993 | 27.0 | 58.6 | 14.4 | 27.0 | 58.6 | 14.4 | 27.0 | 58.6 | 14.4 |
| 1994 | 26.7 | 58.7 | 14.6 | 26.7 | 58.7 | 14.6 | 26.7 | 58.7 | 14.6 |
| 1995 | 26.4 | 58.7 | 14.9 | 26.4 | 58.7 | 14.9 | 26.4 | 58.7 | 14.9 |
| 1996 | 26.3 | 58.6 | 15.1 | 26.3 | 58.6 | 15.1 | 26.3 | 58.6 | 15.1 |
| 1997 | 26.2 | 58.5 | 15.3 | 26.2 | 58.5 | 15.3 | 26.2 | 58.5 | 15.3 |
| 1998 | 26.0 | 58.4 | 15.5 | 26.0 | 58.4 | 15.5 | 26.0 | 58.4 | 15.5 |
| 1999 | 25.9 | 58.4 | 15.7 | 25.9 | 58.4 | 15.7 | 25.9 | 58.4 | 15.7 |
| 2000 | 25.8 | 58.4 | 15.8 | 25.8 | 58.4 | 15.8 | 25.8 | 58.4 | 15.8 |
| 2001 | 25.7 | 58.4 | 15.9 | 25.7 | 58.4 | 15.9 | 25.7 | 58.4 | 15.9 |
| 2002 | 25.5 | 58.4 | 16.0 | 25.5 | 58.4 | 16.0 | 25.5 | 58.4 | 16.0 |
| 2003 | 25.4 | 58.5 | 16.1 | 25.4 | 58.5 | 16.1 | 25.4 | 58.5 | 16.1 |
| 2004 | 25.4 | 58.4 | 16.2 | 25.4 | 58.4 | 16.2 | 25.4 | 58.4 | 16.2 |
| 2005 | 25.3 | 58.4 | 16.3 | 25.3 | 58.4 | 16.3 | 25.3 | 58.4 | 16.3 |
| 2006 | 25.1 | 58.5 | 16.4 | 25.1 | 58.5 | 16.4 | 25.1 | 58.5 | 16.4 |
| 2007 | 25.0 | 58.6 | 16.3 | 25.0 | 58.6 | 16.3 | 25.0 | 58.6 | 16.3 |
| 2008 | 24.9 | 58.7 | 16.4 | 24.9 | 58.7 | 16.4 | 24.9 | 58.7 | 16.4 |
| 2009 | 24.8 | 58.7 | 16.5 | 24.8 | 58.7 | 16.5 | 24.8 | 58.7 | 16.5 |
| 2010 | 24.8 | 58.6 | 16.6 | 24.8 | 58.6 | 16.6 | 24.8 | 58.6 | 16.6 |
| 2011 | 24.7 | 58.6 | 16.7 | 24.7 | 58.6 | 16.7 | 24.7 | 58.6 | 16.7 |
| 2012 | 24.6 | 58.3 | 17.1 | 24.6 | 58.3 | 17.1 | 24.6 | 58.3 | 17.1 |
| 2013 | 24.5 | 57.9 | 17.6 | 24.5 | 57.9 | 17.6 | 24.5 | 57.9 | 17.6 |
| 2014 | 24.6 | 57.4 | 18.0 | 24.6 | 57.4 | 18.0 | 24.6 | 57.4 | 18.0 |
| 2015 | 24.6 | 57.0 | 18.4 | 24.6 | 57.0 | 18.4 | 24.6 | 57.0 | 18.4 |
| 2016 | 24.6 | 56.6 | 18.9 | 24.6 | 56.6 | 18.9 | 24.6 | 56.6 | 18.9 |
| 2017 | 24.4 | 56.3 | 19.3 | 24.4 | 56.3 | 19.3 | 24.4 | 56.3 | 19.3 |
| 2018 | 24.4 | 56.0 | 19.7 | 24.4 | 56.0 | 19.7 | 24.4 | 56.0 | 19.7 |
| 2019 | 24.2 | 55.8 | 20.0 | 24.2 | 55.8 | 20.0 | 24.2 | 55.8 | 20.0 |
| 2020 | 24.1 | 55.5 | 20.4 | 24.1 | 55.5 | 20.4 | 24.1 | 55.5 | 20.4 |
| 2021 | 23.9 | 55.4 | 20.7 | 23.9 | 55.4 | 20.7 | 23.9 | 55.4 | 20.7 |
| 2022 | 23.8 | 55.2 | 21.1 | 23.8 | 55.2 | 21.0 | 23.7 | 55.2 | 21.1 |
| 2023 | 23.6 | 55.0 | 21.4 | 23.6 | 55.0 | 21.3 | 23.6 | 54.9 | 21.5 |
| 2024 | 23.5 | 54.8 | 21.8 | 23.5 | 54.8 | 21.6 | 23.4 | 54.7 | 21.9 |
| 2025 | 23.3 | 54.6 | 22.1 | 23.4 | 54.6 | 22.0 | 23.2 | 54.5 | 22.3 |
| 2026 | 23.2 | 54.4 | 22.5 | 23.3 | 54.5 | 22.3 | 23.0 | 54.3 | 22.7 |
| 2027 | 23.0 | 54.2 | 22.8 | 23.2 | 54.3 | 22.6 | 22.8 | 54.1 | 23.1 |
| 2028 | 22.8 | 54.1 | 23.1 | 23.0 | 54.1 | 22.8 | 22.5 | 54.0 | 23.5 |
| 2029 | 22.6 | 53.9 | 23.5 | 22.9 | 54.0 | 23.1 | 22.2 | 53.8 | 23.9 |
| 2030 | 22.4 | 53.7 | 23.9 | 22.8 | 53.8 | 23.4 | 22.0 | 53.7 | 24.4 |
| 2031 | 22.2 | 53.6 | 24.2 | 22.8 | 53.6 | 23.6 | 21.6 | 53.6 | 24.8 |
| 2032 | 22.0 | 53.5 | 24.5 | 22.7 | 53.5 | 23.9 | 21.3 | 53.5 | 25.2 |
| 2033 | 21.8 | 53.4 | 24.8 | 22.6 | 53.3 | 24.0 | 21.0 | 53.4 | 25.6 |
| 2034 | 21.7 | 53.3 | 25.0 | 22.6 | 53.2 | 24.2 | 20.7 | 53.3 | 26.0 |
| 2035 | 21.5 | 53.2 | 25.3 | 22.6 | 53.1 | 24.4 | 20.5 | 53.2 | 26.3 |
| 2036 | 21.4 | 53.0 | 25.6 | 22.6 | 52.9 | 24.5 | 20.2 | 53.1 | 26.7 |
| 2037 | 21.3 | 52.9 | 25.8 | 22.6 | 52.7 | 24.7 | 20.0 | 52.9 | 27.1 |
| 2038 | 21.2 | 52.7 | 26.1 | 22.7 | 52.5 | 24.8 | 19.8 | 52.8 | 27.5 |
| 2039 | 21.2 | 52.5 | 26.3 | 22.8 | 52.3 | 24.9 | 19.6 | 52.6 | 27.8 |
| 2040 | 21.2 | 52.4 | 26.5 | 22.9 | 52.1 | 25.0 | 19.4 | 52.5 | 28.1 |
| 2041 | 21.2 | 52.3 | 26.5 | 23.0 | 52.0 | 25.0 | 19.3 | 52.4 | 28.3 |
| 2042 | 21.2 | 52.2 | 26.6 | 23.2 | 51.9 | 24.9 | 19.2 | 52.4 | 28.4 |
| 2043 | 21.2 | 52.1 | 26.6 | 23.4 | 51.8 | 24.8 | 19.1 | 52.3 | 28.6 |
| 2044 | 21.3 | 52.0 | 26.7 | 23.5 | 51.7 | 24.8 | 19.0 | 52.2 | 28.8 |
| 2045 | 21.3 | 51.9 | 26.8 | 23.7 | 51.6 | 24.7 | 19.0 | 52.0 | 29.0 |
| 2046 | 21.4 | 51.7 | 26.9 | 23.8 | 51.4 | 24.8 | 18.9 | 51.8 | 29.2 |
| 2047 | 21.4 | 51.6 | 27.0 | 23.9 | 51.3 | 24.8 | 18.9 | 51.6 | 29.5 |
| 2048 | 21.4 | 51.4 | 27.2 | 24.0 | 51.2 | 24.8 | 18.9 | 51.4 | 29.7 |
| 2049 | 21.5 | 51.3 | 27.2 | 24.0 | 51.2 | 24.8 | 18.9 | 51.2 | 29.9 |
| 2050 | 21.5 | 51.2 | 27.3 | 24.0 | 51.2 | 24.7 | 18.9 | 51.0 | 30.1 |
| 2051 | 21.5 | 51.1 | 27.4 | 24.0 | 51.2 | 24.7 | 18.9 | 50.8 | 30.3 |
| 2052 | 21.4 | 51.0 | 27.5 | 24.0 | 51.2 | 24.7 | 18.8 | 50.6 | 30.6 |
| 2053 | 21.4 | 51.0 | 27.6 | 24.0 | 51.3 | 24.7 | 18.8 | 50.4 | 30.8 |
| 2054 | 21.4 | 50.9 | 27.7 | 24.0 | 51.3 | 24.7 | 18.8 | 50.2 | 31.0 |
| 2055 | 21.3 | 50.8 | 27.8 | 23.9 | 51.4 | 24.7 | 18.7 | 50.0 | 31.3 |
| 2056 | 21.3 | 50.8 | 27.9 | 23.9 | 51.4 | 24.7 | 18.7 | 49.9 | 31.5 |
| 2057 | 21.2 | 50.8 | 28.0 | 23.8 | 51.5 | 24.6 | 18.6 | 49.7 | 31.7 |
| 2058 | 21.1 | 50.8 | 28.1 | 23.8 | 51.6 | 24.6 | 18.5 | 49.6 | 31.9 |
| 2059 | 21.1 | 50.8 | 28.1 | 23.7 | 51.7 | 24.5 | 18.4 | 49.6 | 32.0 |
| 2060 | 21.0 | 50.9 | 28.1 | 23.7 | 51.9 | 24.4 | 18.3 | 49.5 | 32.2 |
| 2061 | 20.9 | 51.0 | 28.1 | 23.6 | 52.0 | 24.4 | 18.2 | 49.5 | 32.3 |
| 2062 | 20.8 | 51.0 | 28.2 | 23.6 | 52.1 | 24.3 | 18.1 | 49.4 | 32.5 |
| 2063 | 20.7 | 51.0 | 28.2 | 23.5 | 52.2 | 24.2 | 17.9 | 49.4 | 32.7 |
| 2064 | 20.7 | 51.1 | 28.3 | 23.5 | 52.3 | 24.2 | 17.8 | 49.3 | 32.9 |
| 2065 | 20.6 | 51.1 | 28.3 | 23.5 | 52.4 | 24.2 | 17.7 | 49.3 | 33.0 |
| 2066 | 20.5 | 51.0 | 28.5 | 23.4 | 52.3 | 24.2 | 17.5 | 49.2 | 33.3 |
| 2067 | 20.4 | 51.0 | 28.6 | 23.4 | 52.3 | 24.2 | 17.4 | 49.1 | 33.5 |
| 2068 | 20.4 | 51.0 | 28.7 | 23.4 | 52.3 | 24.2 | 17.3 | 49.0 | 33.8 |
| 2069 | 20.3 | 50.9 | 28.8 | 23.4 | 52.3 | 24.2 | 17.1 | 48.9 | 34.0 |
| 2070 | 20.2 | 50.9 | 28.9 | 23.5 | 52.3 | 24.3 | 17.0 | 48.7 | 34.2 |
- Reading note: on 1 January 2070, under the baseline scenario, 29% of the population in France would be aged 65 or over.
- Coverage: Metropolitan France for years up to 1990, France excluding Mayotte from 1991 to 2013, France from 2014 onwards.
- Source: INSEE, population estimates and baseline population projection scenario 2021-2070.
graphiqueChart 5a - Population structure by age from 1970 to 2070 under various scenarios
- Reading note: on 1 January 2070, under the baseline scenario, 29% of the population in France would be aged 65 or over.
- Coverage: Metropolitan France for years up to 1990, France excluding Mayotte from 1991 to 2013, France from 2014 onwards.
- Source: INSEE, population estimates and baseline population projection scenario 2021-2070.
The growth in the number of people aged 65 or above would slow from 2040 onwards, with the last baby boom generation, born in 1974, moving into this age bracket. In 2070, the proportion of 65 and overs would be 29%, an increase of 8 points compared to 2021. This rise would be the same as that seen between 1972 and 2021, a period of the same length: from 13% to 21% (+8 points as well).
From now to 2040, the continued ageing of the population is unavoidable
From now to 2040, the continued ageing of the population is almost certain, and its scale known. Indeed, it depends primarily on the past, that is to say the increase in life expectancy that has already occurred, as well as the increasing age of the generations that have already been born, in particular those of the baby boom, much more so than the future increase in life expectancy. Under the baseline scenario, the old-age dependency ratio would rise from 37 in 2021 to 51 in 2040 (Chart 6). Even under scenarios with less ageing, it would increase in almost similar proportions from now until 2040: it would reach 49 under the scenario in which life expectancy remains at its 2019 level, or even 48 under the “young population” scenario, which combines small increases in life expectancy with a higher level of immigration of people aged 20 to 64. Under the “aged population” scenario, the ageing of the population would also be similar to that given under the baseline scenario in 2040, with a ratio of 53.
tableauChart 6 - Old-age dependency ratio from 1970 to 2070 under various scenarios
| Passed | baseline scenario | low life expectancy | high life expectancy | young population | aged population | constant life expectancy | |
|---|---|---|---|---|---|---|---|
| 1970 | 23.7 | ||||||
| 1971 | 23.9 | ||||||
| 1972 | 24.0 | ||||||
| 1973 | 24.2 | ||||||
| 1974 | 24.4 | ||||||
| 1975 | 24.6 | ||||||
| 1976 | 24.8 | ||||||
| 1977 | 24.8 | ||||||
| 1978 | 25.1 | ||||||
| 1979 | 25.2 | ||||||
| 1980 | 25.3 | ||||||
| 1981 | 24.7 | ||||||
| 1982 | 23.8 | ||||||
| 1983 | 23.1 | ||||||
| 1984 | 22.5 | ||||||
| 1985 | 22.0 | ||||||
| 1986 | 22.5 | ||||||
| 1987 | 22.9 | ||||||
| 1988 | 23.2 | ||||||
| 1989 | 23.6 | ||||||
| 1990 | 23.9 | ||||||
| 1991 | 24.0 | ||||||
| 1992 | 24.3 | ||||||
| 1993 | 24.6 | ||||||
| 1994 | 24.9 | ||||||
| 1995 | 25.3 | ||||||
| 1996 | 25.7 | ||||||
| 1997 | 26.2 | ||||||
| 1998 | 26.6 | ||||||
| 1999 | 26.8 | ||||||
| 2000 | 27.1 | ||||||
| 2001 | 27.3 | ||||||
| 2002 | 27.5 | ||||||
| 2003 | 27.6 | ||||||
| 2004 | 27.7 | ||||||
| 2005 | 27.9 | ||||||
| 2006 | 28.0 | ||||||
| 2007 | 27.8 | ||||||
| 2008 | 27.9 | ||||||
| 2009 | 28.1 | ||||||
| 2010 | 28.3 | ||||||
| 2011 | 28.6 | ||||||
| 2012 | 29.4 | ||||||
| 2013 | 30.4 | ||||||
| 2014 | 31.3 | ||||||
| 2015 | 32.3 | ||||||
| 2016 | 33.3 | ||||||
| 2017 | 34.3 | ||||||
| 2018 | 35.1 | ||||||
| 2019 | 35.9 | ||||||
| 2020 | 36.8 | ||||||
| 2021 | 37.4 | 37.4 | 37.4 | 37.4 | 37.4 | 37.4 | 37.4 |
| 2022 | 38.2 | 38.1 | 38.2 | 38.1 | 38.2 | 38.2 | |
| 2023 | 38.9 | 38.8 | 39.1 | 38.8 | 39.1 | 38.9 | |
| 2024 | 39.7 | 39.6 | 39.9 | 39.5 | 40.0 | 39.7 | |
| 2025 | 40.5 | 40.3 | 40.8 | 40.2 | 40.9 | 40.4 | |
| 2026 | 41.3 | 41.1 | 41.6 | 40.9 | 41.8 | 41.2 | |
| 2027 | 42.1 | 41.7 | 42.5 | 41.5 | 42.7 | 41.8 | |
| 2028 | 42.8 | 42.4 | 43.3 | 42.1 | 43.6 | 42.5 | |
| 2029 | 43.6 | 43.1 | 44.2 | 42.8 | 44.5 | 43.2 | |
| 2030 | 44.4 | 43.8 | 45.1 | 43.5 | 45.4 | 43.9 | |
| 2031 | 45.1 | 44.5 | 45.9 | 44.1 | 46.3 | 44.5 | |
| 2032 | 45.8 | 45.1 | 46.7 | 44.6 | 47.2 | 45.1 | |
| 2033 | 46.4 | 45.6 | 47.4 | 45.1 | 47.9 | 45.6 | |
| 2034 | 47.0 | 46.1 | 48.1 | 45.5 | 48.7 | 46.0 | |
| 2035 | 47.6 | 46.5 | 48.8 | 45.9 | 49.5 | 46.5 | |
| 2036 | 48.2 | 47.0 | 49.6 | 46.4 | 50.3 | 47.0 | |
| 2037 | 48.9 | 47.6 | 50.4 | 46.9 | 51.2 | 47.5 | |
| 2038 | 49.5 | 48.1 | 51.2 | 47.3 | 52.0 | 48.0 | |
| 2039 | 50.1 | 48.5 | 51.9 | 47.7 | 52.9 | 48.4 | |
| 2040 | 50.5 | 48.8 | 52.5 | 47.9 | 53.5 | 48.6 | |
| 2041 | 50.8 | 48.9 | 52.9 | 48.0 | 53.9 | 48.7 | |
| 2042 | 50.9 | 48.9 | 53.2 | 47.9 | 54.3 | 48.7 | |
| 2043 | 51.1 | 49.0 | 53.6 | 48.0 | 54.7 | 48.7 | |
| 2044 | 51.3 | 49.0 | 53.9 | 47.9 | 55.2 | 48.7 | |
| 2045 | 51.6 | 49.1 | 54.3 | 48.0 | 55.7 | 48.7 | |
| 2046 | 52.0 | 49.4 | 54.9 | 48.2 | 56.4 | 48.9 | |
| 2047 | 52.5 | 49.7 | 55.5 | 48.3 | 57.2 | 49.1 | |
| 2048 | 52.9 | 49.9 | 56.1 | 48.4 | 57.9 | 49.2 | |
| 2049 | 53.1 | 50.0 | 56.4 | 48.3 | 58.4 | 49.2 | |
| 2050 | 53.3 | 50.1 | 56.8 | 48.3 | 59.1 | 49.2 | |
| 2051 | 53.6 | 50.2 | 57.3 | 48.2 | 59.7 | 49.2 | |
| 2052 | 53.9 | 50.4 | 57.7 | 48.2 | 60.4 | 49.3 | |
| 2053 | 54.2 | 50.5 | 58.2 | 48.2 | 61.1 | 49.3 | |
| 2054 | 54.5 | 50.6 | 58.6 | 48.1 | 61.8 | 49.3 | |
| 2055 | 54.7 | 50.7 | 59.0 | 48.1 | 62.5 | 49.3 | |
| 2056 | 55.0 | 50.8 | 59.4 | 48.0 | 63.1 | 49.2 | |
| 2057 | 55.1 | 50.9 | 59.7 | 47.8 | 63.7 | 49.1 | |
| 2058 | 55.2 | 50.9 | 59.9 | 47.7 | 64.2 | 49.0 | |
| 2059 | 55.2 | 50.7 | 60.0 | 47.4 | 64.6 | 48.7 | |
| 2060 | 55.2 | 50.6 | 60.1 | 47.1 | 64.9 | 48.4 | |
| 2061 | 55.2 | 50.5 | 60.3 | 46.9 | 65.3 | 48.2 | |
| 2062 | 55.3 | 50.4 | 60.5 | 46.7 | 65.8 | 48.0 | |
| 2063 | 55.3 | 50.3 | 60.6 | 46.4 | 66.1 | 47.8 | |
| 2064 | 55.4 | 50.3 | 60.8 | 46.3 | 66.6 | 47.7 | |
| 2065 | 55.5 | 50.3 | 61.1 | 46.2 | 67.0 | 47.5 | |
| 2066 | 55.8 | 50.5 | 61.5 | 46.3 | 67.7 | 47.6 | |
| 2067 | 56.0 | 50.6 | 61.9 | 46.3 | 68.4 | 47.6 | |
| 2068 | 56.3 | 50.8 | 62.3 | 46.3 | 69.0 | 47.6 | |
| 2069 | 56.5 | 50.9 | 62.6 | 46.3 | 69.6 | 47.6 | |
| 2070 | 56.8 | 51.1 | 63.1 | 46.4 | 70.2 | 47.7 |
- Reading note: on 1 January 2070, under the aged population scenario, there would be 70 people aged 65 or over for every 100 people aged 20 to 64.
- Coverage: Metropolitan France for years up to 1990, France excluding Mayotte from 1991 to 2013, France from 2014 onwards.
- Source: INSEE, population estimates and baseline population projection scenario 2021-2070.
graphiqueChart 6 - Old-age dependency ratio from 1970 to 2070 under various scenarios
- Reading note: on 1 January 2070, under the aged population scenario, there would be 70 people aged 65 or over for every 100 people aged 20 to 64.
- Coverage: Metropolitan France for years up to 1990, France excluding Mayotte from 1991 to 2013, France from 2014 onwards.
- Source: INSEE, population estimates and baseline population projection scenario 2021-2070.
Between 2040 and 2070, the change in the old-age dependency ratio is much more uncertain. It could increase slightly under the baseline scenario (ratio of 57 in 2070), at a steadier rate under the “aged population” scenario (70) or decrease slightly under the “young population” scenario (46).
Box – How do we estimate the number of inhabitants in France in 2070?
INSEE makes population projections approximately every five years, using the component method that consists in separately projecting the changes in fertility, mortality and migrations, before looking at the change in population that results. For each component, recent trends (excluding the Covid-19 pandemic) are extended to develop a baseline assumption and alternative assumptions taking into account the uncertainties inherent in this exercise. A consultation has enabled us to collect opinions from 46 experts on the various options available for use. Their responses, together with the method used, are documented in Algava, Blanpain (2021a).
The baseline assumption is that of a stabilisation of the total fertility rate at 1.80 children per woman from 2022 onwards (it was 1.83 in 2020), and a continued rise in the average age at childbirth to 33 in 2052, at which point it is projected to stabilise. Under the low assumption, the total fertility rate would fall between now and 2030, before stabilising at 1.60 children per woman. Under the high assumption, the total fertility rate would increase between now and 2030, before stabilising at 2.00 children per woman, the same level as between 2006 and 2014. A working assumption, which is very low and similar to the current average fertility rate of the 27 EU nations, takes a total fertility rate of 1.50 from 2030 onwards.
The baseline mortality assumption is that the risks of death by gender and age will reduce at the same rate as over the last decade, excluding the Covid-19 pandemic, i.e. 2010-2019. This applies to all generations, excluding those born between 1941 and 1955 for which the assumption used is that of a continued stagnation in mortality as observed to date [Blanpain, 2020]. These assumptions would lead to an increase in life expectancy at birth between now and 2070 of 4.9 years for women and 8.4 years for men, i.e. 90.0 and 87.5, respectively. Under the high assumption, life expectancy would be 3.5 years higher in 2070 (93.5 for women and 91.0 for men) and under the low assumption, 3.5 years lower (86.5 and 84.0), which is a faster/slower pace of reduction in mortality than that seen over the last decade. We have a working assumption based on a stagnation of life expectancy up to 2070 at its 2019 value (85.6 for women and 79.7 for men).
The net migration, which is the difference between the number of people coming into and leaving the country, is assumed to remain constant at +70,000 people per year up to 2070. Given the high level of uncertainty surrounding its level, there is quite a wide range between alternative assumptions: +20,000 people per year for the low assumption, +120,000 people per year for the high assumption and 0 (number of incoming and outgoing people offset each other) for the working assumption. It is the range within which the net migration has fluctuated for the majority of the last 50 years.
12 of the 30 scenarios combining the various assumptions are presented below:
- the baseline scenario with the three baseline assumptions;
- the six scenarios that only differ from the baseline scenario in one assumption: for example, in the high fertility scenario, the total fertility rate is 2.00, everything else remains the same as the baseline scenario;
- the high population scenario, which combines the high assumptions of the three scenarios; the low population scenario, which is its opposite;
- the aged population which combines the low fertility and migration and high life expectancy assumptions, and its inverse counterpart, the young population scenario;
- the constant life expectancy scenario, which combines a stagnation of life expectancy at birth at its 2019 level with the baseline fertility and migration assumptions.
The full results of the scenarios are given in Algava, Blanpain (2021b).
Compared with the previous projection exercise, published in 2016, recent changes in fertility and life expectancy have led to a downward revision of the assumptions, causing a relatively considerable reduction in the projected population for 2070.
Sources
The population projections for 2021-2070 consist in estimating the population numbers broken down by gender and age on 1 January of each year in France. The starting point is based on the population estimates and vital statistics [Papon, Beaumel, 2021].
On 1 January n+1, the number of inhabitants is equal to the population on 1 January of year n, plus the number of births and the net migration for year n, less the number of deaths for year n.
Définitions
The net migration is the difference between the number of people entering the country and the number of people leaving over the course of the year.
The natural balance is the difference between the number of births and the number of deaths over the course of the year.
The total fertility rate measures the number of children that a woman would have over her lifetime, if the fertility rates seen in the given year for each age were to stay the same. It is a synthetic indicator of fertility for one year.
Life expectancy at birth represents the average life span of a notional generation subject to the mortality conditions for each age in a given year. It is a synthetic indicator of mortality for a given year.
The old-age dependency ratio measures the number of people aged 65 or over, primarily retired, for every 100 people aged between 20 and 64, who primarily fall into age groups of professional activity.
Learn more
Education tool for population projections
Algava É., Blanpain N., "Population projections 2021-2070 for France: method and assumptions", Working papers No. 2021-05, November 2021a.
Algava É., Blanpain N., "Projections de population 2021-2070 pour la France", Insee Résultats, November 2021b.
Papon S., Beaumel C., "Avec la pandémie de Covid-19, nette baisse de l’espérance de vie et chute du nombre de mariages", Insee Première No. 1846, March 2021.
Blanpain N., "La mortalité stagne à l’âge adulte pour les générations nées entre 1941 et 1955", Insee Première No. 1824, November 2020.
Blanpain N., Buisson G., "Projections de population à l’horizon 2070, deux fois plus de personnes de 75 ans ou plus qu’en 2013", Insee Première No. 1619, November 2016.