


 14 December 2018
2018- n° 326Fall back in business start-ups in November 2018 Enterprise births - November 2018
14 December 2018
2018- n° 326Fall back in business start-ups in November 2018 Enterprise births - November 2018
In November 2018, the number of business births for all enterprises fell back (-5.3% after +4.4% in October, seasonally and working-day adjusted). Conventional businesses start-ups are practically stable (-0.2% after +0.8%) whereas micro-entrepreneurs' registrations dropped sharply (-11.2% after +8.9%).
In November 2018, the number of business births for all enterprises fell back (-5.3% after +4.4% in October, seasonally and working-day adjusted). Conventional businesses start-ups are practically stable (-0.2% after +0.8%) whereas micro-entrepreneurs' registrations dropped sharply (-11.2% after +8.9%).
graphiqueGraph1 – Monthly business start-ups (SA-WDA *)

- * Seasonally and working-day adjusted data
- Source: INSEE, REE (Sirene)
tableauTable1 – Business set-ups by month (SA-WDA *)
| Aug. 2018 | Sept. 2018 | Oct. 2018 | Nov. 2018 | |
|---|---|---|---|---|
| Total businesses set-ups | 59,002 | 59,345 | 61,974 | 58,667 |
| Variation [m-o-m] % | 4.2 | 0.6 | 4.4 | -5.3 |
| Conventional businesses | 32,223 | 32,608 | 32,870 | 32,818 |
| Variation [m-o-m] % | 2.8 | 1.2 | 0.8 | -0.2 |
| Self-managed micro-entrepreneurs | 26,779 | 26,737 | 29,104 | 25,849 |
| Variation [m-o-m] % | 6.0 | -0.2 | 8.9 | -11.2 |
- * Seasonally and working-day adjusted data
- Source: INSEE, REE (Sirene)
+17.3% over the twelve last months
The raw number of business start-ups totted up during the last twelve months slowed down slightly (+17.3% after +18.5% in October and +17.8% in September). All the types of business start-ups increased: micro-entrepreneurs' registrations (+28.0%), conventional sole proprietorship start-ups (+21.1%) and, to a lesser extent, company births (+1.5%).
Upsurge of business set-ups in transportation and storage over the three last months
The raw number of business start-ups totted up during the last three months soared (+16.3% over one year). The sector “Transportation and storage” was the one that contributed the most to this rise (contribution of 5.6 points1). Over the last three months and compared to the same months a year earlier, the number of creations grew by 9,100 in this sector (of which +7,700 for other postal and mail activities - including home delivery).
More than two business set-ups out of five are self-managed micro-entrepreneurs' registrations
In November 2018, the share of micro–entrepreneurs' registrations in the businesses set up over the last twelve months grew for the thirteenth month in a row and reached 44.4%.
tableauTable0 – Business set-ups distribution by type
| Sept. 2018 | Oct. 2018 | Nov. 2018 | |
|---|---|---|---|
| Companies | 29.7 | 29.2 | 29.2 |
| Sole proprietorships excluding self-managed micro-entrepreneurs | 26.6 | 26.5 | 26.4 |
| Self-managed micro-entrepreneurs | 43.7 | 44.3 | 44.4 |
- Source: INSEE, REE (Sirene)

1 The contribution of a sector to the overall variation is the variation observed in this sector, weighted by the share of this sector in the total number of births.
tableauTable2 – Cumulated business start-ups by type
| Moving total % change * | Moving total | Moving total | ||
|---|---|---|---|---|
| over 3 months | over 12 months | January- November 2018 | January- November 2017 | |
| Total | 16.3 | 17.3 | 640,821 | 543,133 |
| Companies | 4.7 | 1.5 | 183,900 | 180,743 |
| Conventional sole proprietorships | 12.2 | 21.1 | 169,291 | 139,131 |
| Self-managed micro-entrepreneurs | 26.4 | 28.0 | 287,630 | 223,259 |
- * Total of business start-ups during the last 3 or 12 months compared with the same months a year earlier
- Source: INSEE, REE (Sirene)
Revisions
The variation in the overall number of business births in October 2018 has been raised by 0.1 points to +4.4% due to the revision of raw data and the update of the SA-WDA parameters.
Business set-ups by economic activity
graphiqueGraph2 – Trade and business support activities monthly start-ups (SA-WDA *)
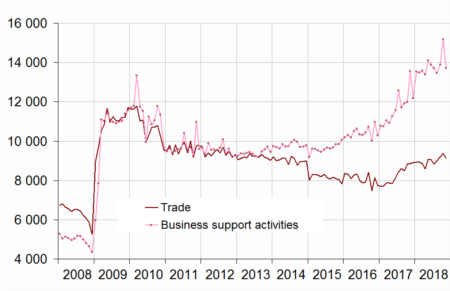
- * Seasonally and working-day adjusted data
- Source: INSEE, REE (Sirene)
graphiqueGraph3 – Construction and transportation business monthly set-ups (SA-WDA *)
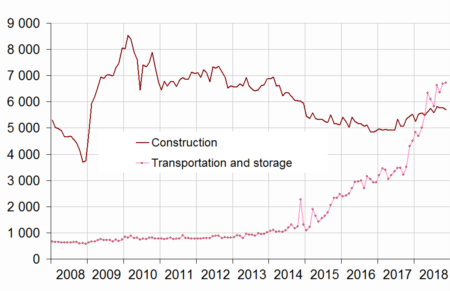
- * Seasonally and working-day adjusted data
- Source: INSEE, REE (Sirene)
tableauTable3 – Number of monthly business set-ups (incl. self-managed micro-entrepreneurs)
| NA | Sept. 2018 | Oct. 2018 | Nov. 2018 | |
|---|---|---|---|---|
| Total | 59,345 | 61,974 | 58,667 | |
| Industry | BE | 2,415 | 2,494 | 2,461 |
| Of which Manufacturing | C | 2,166 | 2,232 | 2,125 |
| Construction | FZ | 5,772 | 5,791 | 5,698 |
| Wholesale and retail trade, Transport, Accommodation and Food and beverage activities | GI | 18,376 | 18,989 | 18,766 |
| Trade | G | 9,202 | 9,367 | 9,131 |
| Transportation and storage | H | 6,357 | 6,686 | 6,732 |
| Accommodation and food service activities | I | 2,816 | 2,936 | 2,903 |
| Information and communication | JZ | 2,987 | 3,046 | 2,941 |
| Financial and insurance activities | KZ | 1,495 | 1,507 | 1,520 |
| Real estate activities | LZ | 2,401 | 2,428 | 2,375 |
| Business support activities | MN | 13,883 | 15,179 | 13,714 |
| Public administration and defence, education, human health and social work activities | OQ | 6,543 | 6,887 | 6,144 |
| Other services activities | RS | 5,473 | 5,655 | 5,048 |
- * Seasonally and working-day adjusted data
- Source: INSEE, REE (Sirene)
tableauTable4 – Fluctuation in the number of business set-ups (incl. self-managed micro-entrepreneurs)
| NA | Nov. 18 / Oct. 18 | Moving total % change** | ||
|---|---|---|---|---|
| SA-WDA * | over 3 months | over 12 months | ||
| Total | -5.3 | 16.3 | 17.3 | |
| Industry | BE | -1.3 | 12.9 | 13.2 |
| Of which Manufacturing | C | -4.8 | 12.9 | 15.3 |
| Construction | FZ | -1.6 | 9.7 | 10.5 |
| Wholesale and retail trade, Transport, Accommodation and Food and beverage activities | GI | -1.2 | 25.7 | 23.4 |
| Trade | G | -2.5 | 6.4 | 9.5 |
| Transportation and storage | H | 0.7 | 78.2 | 68.7 |
| Accommodation and food service activities | I | -1.1 | 10.5 | 7.9 |
| Information and communication | JZ | -3.5 | 15.9 | 17.0 |
| Financial and insurance activities | KZ | 0.9 | 6.1 | 5.2 |
| Real estate activities | LZ | -2.2 | 21.2 | 20.0 |
| Business support activities | MN | -9.7 | 14.6 | 18.2 |
| Public administration and defence, education, human health and social work activities | OQ | -10.8 | 5.9 | 7.4 |
| Other services activities | RS | -10.7 | 17.4 | 21.1 |
- * Seasonally and working-day adjusted data
- ** Total of business start-ups during the last 3 or 12 months compared with the same months a year earlier
- Source: INSEE, REE (Sirene)
Documentation
Note méthodologique_anglaise_ Février 2018 (pdf,29 Ko)
Pour en savoir plus
Time series : Business demography
