


 24 July 2018
2018- n° 187In July 2018, the economic climate is stable in the building construction industry Monthly survey of building - July 2018
24 July 2018
2018- n° 187In July 2018, the economic climate is stable in the building construction industry Monthly survey of building - July 2018
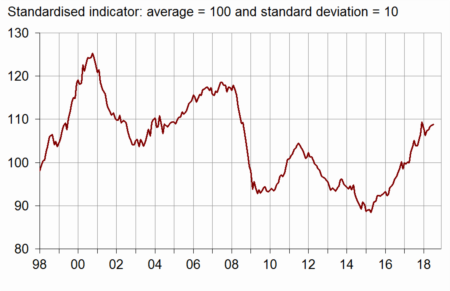
According to the business managers in the building construction industry surveyed in July 2018, the business climate is stable. The composite indicator remains at 109, well above its long-term average (100).

- Business managers' opinion on past activity has improved markedly
- More business managers report an increase in their expected staff size
- Business managers consider their order books slightly more filled
- Production capacity remains more used than in average, recruiting problems keep intensifying
- More business managers have announced a deterioration in the cash-flow position
According to the business managers in the building construction industry surveyed in July 2018, the business climate is stable. The composite indicator remains at 109, well above its long-term average (100).
graphiqueGraph1 – Business climate composite indicator
The turning point indicator remains in the favourable outlook area.
graphiqueGraph2 – Turning-point indicator
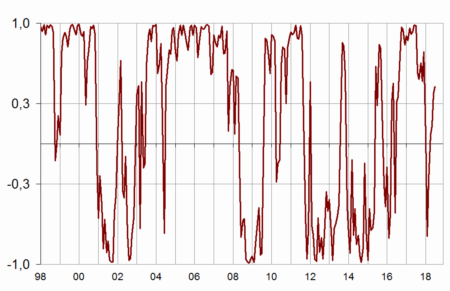
- Note: close to 1 (respectively –1), it indicates a favourable climate (respectively unfavourable). The uncertainty area is between –0.3 and +0.3
Business managers' opinion on past activity has improved markedly
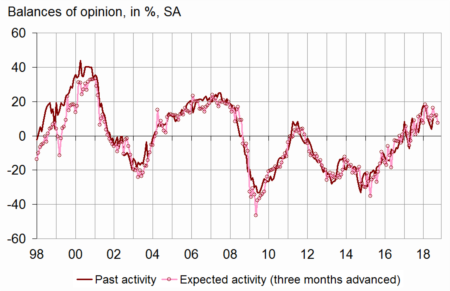
In July 2018, many more business managers than in June have indicated an increase in their activity over the last three months. After five consecutive months of decrease, the corresponding balance of opinion has recovered and has exceeded more largely its long-term average. However, business managers are less optimistic for the next few months: the balance on expected activity has decreased while remaining well above its long-term average. They are also less upbeat than in April 2018 about the general outlook of the sector. The corresponding balance, which had reached in January 2018 its highest level since October 2000, has decreased again but remains significantly above its long-term average.
graphiqueGraph3 – Activity tendency in building construction
tableauTable1 – Building industry economic outlook
| Mean* | April 18 | May 18 | June 18 | July 18 | |
|---|---|---|---|---|---|
| Composite indicator | 100 | 108 | 108 | 109 | 109 |
| Past activity | –4 | 10 | 6 | 4 | 10 |
| Expected activity | –6 | 16 | 11 | 12 | 8 |
| Gen. business outlook | –17 | 17 | 10 | ||
| Past employment | –5 | 4 | 9 | 5 | 4 |
| Expected employment | –4 | 11 | 10 | 10 | 15 |
| Opinion on order books | –24 | –18 | –16 | –10 | –8 |
| Order books (in month) | 5.6 | 7.4 | 7.3 | 7.3 | 7.4 |
| Production capacity utilisation rate | 88.5 | 89.7 | 89.7 | 90.2 | 90.2 |
| Obstacles to production increase (in %) | 32 | 32 | 35 | 37 | 38 |
| - Because of workforce shortage (in %) | 13.7 | 11.7 | 14.9 | 16.3 | 16.6 |
| Recruiting problems (in %) | 57 | 70 | 72 | ||
| Expected prices | –14 | 5 | 5 | 4 | 8 |
| Cash-flow position | –10 | –7 | –17 | ||
| Repayment period | 30 | 27 | 34 |
- * Mean since April 1975 for the composite indicator and since
- September 1993 for the balances of opinion.
- Source: INSEE, French business survey in the building industry
More business managers report an increase in their expected staff size
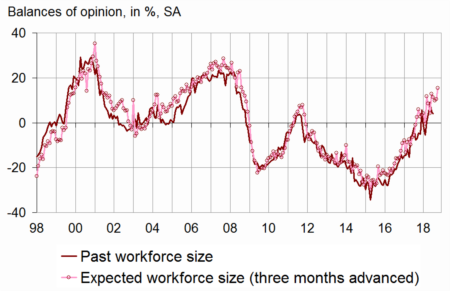
In July 2018, slightly fewer business managers than in June have indicated an increase in their staff size over the last three months. The corresponding balance has decreased a little and remains well above its long-term average. However, the balance of opinion on expected employment has increased sharply after being stable in June, and stands well above its long-term average.
graphiqueGraph4 – Workforce size tendency in building construction
Business managers consider their order books slightly more filled
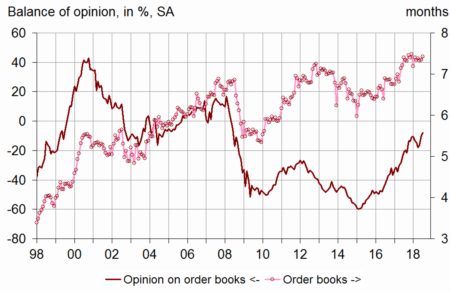
In July 2018, a few more business managers than in June 2018 consider that their order books are well filled for the period. The corresponding balance of opinion has increased for the third consecutive month and stands at its highest level for ten years, sharply above its long-term average. With their present staff size, business managers consider that their order books provide 7.4 months of work, practically as in the previous month and clearly above the long-term average (5.6 months).
graphiqueGraph5 – Order books
Production capacity remains more used than in average, recruiting problems keep intensifying
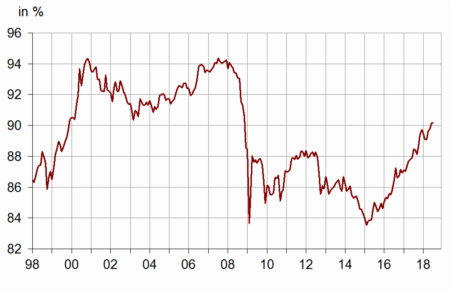
The production capacity utilisation rate is stable in July 2018, at its highest level since December 2008. At 90.2%, it stands above its long-term average (88.5%). At the same time, 38% of business managers have indicated production bottlenecks, six points more than in long-term average. Otherwise, the share of business managers encountering recruiting problems has continued its rise since October 2016. It has reached 72%, its highest level since October 2008, well above its long-term average (57%).
graphiqueGraph6 – Production capacity utilisation rate
More business managers have announced a deterioration in the cash-flow position
In July 2018, many more business managers than in April 2018 have indicated a deterioration in their cash-flow position. The corresponding balance has decreased by ten points and has moved below its long-term average. At the same time, more business managers have reported that their customers' repayment period has been lengthened. The balance of opinion has exceeded its long-term average.
Otherwise, more business managers than in July 2018 have announced that they will increase their prices during the next three months. The corresponding balance has increased and stands well above its long-term average.
Documentation
Abbreviated methodology (pdf,177 Ko)
Pour en savoir plus
