


 27 June 2018
2018- n° 168In June 2018, households' confidence has declined Monthly consumer confidence survey - June 2018
27 June 2018
2018- n° 168In June 2018, households' confidence has declined Monthly consumer confidence survey - June 2018
In June 2018, households' confidence in the economic situation has deteriorated: the synthetic index has lost 2 points and reached 97, its lowest level since August 2016. It stands below its long term average (100).
In June 2018, households' confidence in the economic situation has deteriorated: the synthetic index has lost 2 points and reached 97, its lowest level since August 2016. It stands below its long term average (100).
graphiqueGraph1 – Consumer confidence synthetic index
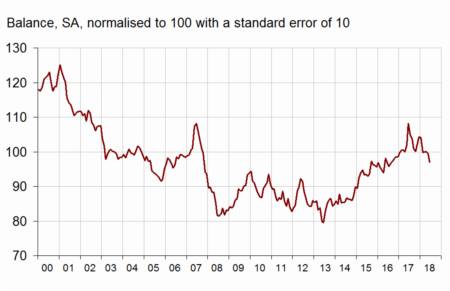
- Source: INSEE
Personal situation
Personal financial situation: decreasing slightly
In June, households' balances of opinion on their past personal situation has slightly decreased (−2 points) while the one on their expected financial situation remained stable. Both balances stand below their long term average.
The share of households considering it is a suitable time to make major purchases has decreased strongly in June (−4 points). However, the corresponding balance stays clearly above its long term average.
Expected saving capacity: clear drop
In June, households' opinion balance on their expected saving capacity has dropped: it has lost 6 points after gaining 6 in May, thus returning to its long term average. The balance on their current saving capacity has been virtually stable (+1 point) and stays slightly above its long term average.
The share of households considering it a suitable time to save has been stable in June. Thus, the corresponding balance clearly remains below its long term average.
Economic situation in France
Standard of living in France: opinion's balances deteriorating again
In June, households have been more pessimistic about their future standard of living in France: the corresponding balance has lost 5 points, after −4 in May. Henceforth, it clearly stands below its long term average. Households were also less numerous to consider that the past standard of living in France improved during the past twelve months: the corresponding balance has lost 4 points after −3 in May, but remains slightly above its long term average.
graphiqueGraph2 – Balances on personal financial situation and standard of living in France
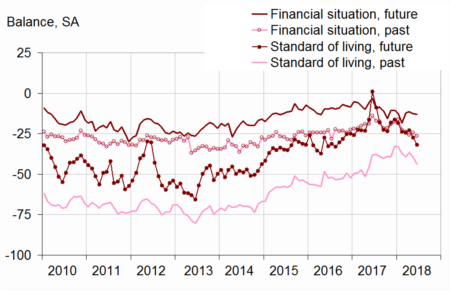
- Source: INSEE
Unemployment: fears rising sharply again
Households' fears about the unemployment trend have increased massively in June: the corresponding balance has gained 18 points, reaching its highest level since May 2017. However, it is still clearly below its long term average.
graphiqueGraph3 – Households' unemployment expectations
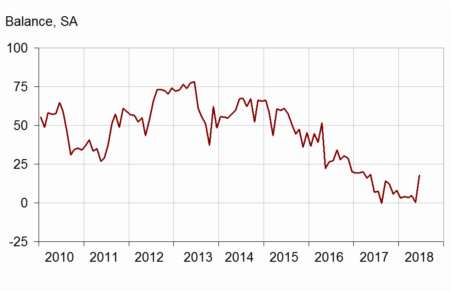
- Source: INSEE
Perceived inflation: rising again
In June, households were more numerous than the previous month to consider that prices were on the rise during the last twelve months: the corresponding balance has gained 4 points, after +9 points in May. Still, it remains above its long term average.
Households were almost as numerous as in May to expect prices to increase during the next twelve months (−1 point). The corresponding balance stays clearly above its long term average.
graphiqueGraph4 – Households' perception of prices
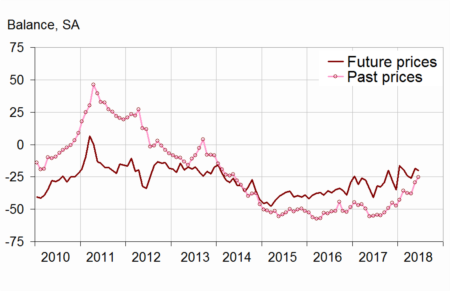
- Source: INSEE
Revision
Due to the actualisation of the seasonal adjustment coefficients (CVS), the synthetic index of May 2018 was revised downwards by one point: it now stands at 99.
tableauTable – CONSUMER OPINION: synthetic index and opinion balances
| Avg. (1) | March 18 | April 18 | May 18 | June 18 | |
|---|---|---|---|---|---|
| Synthetic index (2) | 100 | 100 | 100 | 99 | 97 |
| Financial sit., past 12 m. | –21 | –24 | –26 | –24 | –26 |
| Financial sit., next 12 m. | –5 | –12 | –12 | –13 | –13 |
| Current saving capacity | 8 | 9 | 10 | 10 | 11 |
| Expected saving capacity | –9 | –8 | –9 | –3 | –9 |
| Savings intentions, next 12 m. | 17 | 5 | 4 | 8 | 8 |
| Major purchases intentions, next 12 m. | –14 | –6 | –4 | –5 | –9 |
| Standard of living, past 12 m. | –45 | –39 | –37 | –40 | –44 |
| Standard of living, next 12 m. | –25 | –24 | –23 | –27 | –32 |
| Unemployment, next 12 m. | 34 | 3 | 5 | 0 | 18 |
| Consumer prices, past 12 m. | –17 | –38 | –38 | –29 | –25 |
| Consumer prices, next 12 m. | –34 | –24 | –26 | –19 | –20 |
- (1) Average value between January 1987 and December 2017
- (2) The indicator is normalised in such a way that its average equals 100 and standard error equals 10 over the estimation period (1987-2017).
- Source: INSEE, monthly consumer confidence survey
Pour en savoir plus
