


 30 March 2018
2018- n° 90In January 2018, services output grew sharply (+1.6%) Index of services production - January 2018
30 March 2018
2018- n° 90In January 2018, services output grew sharply (+1.6%) Index of services production - January 2018
After a near stability in december (+0.1%), services output grew sharply (+1.6%) in January 2018.
- Services output rose markedly over the last three months
- Output grew sharply over a year
- Strong rebound in household services
- Further increase in transportation and storage
- Significant recover in accommodation and food service activities
- Slight grow in business support
- Further rise in information and communication
- Rebasing and reference change to 2015

Please note: In accordance with European directives, the index of services production and the associated turnover indicators use 2015 as base year from this publication.
After a near stability in december (+0.1%), services output grew sharply (+1.6%) in January 2018.
Services output rose markedly over the last three months
Over the last three months (November to January), services production increased by 1.6% compared to the previous three months.
It rose sharply in business support activities (+1.4%), information and communication (+1.7%), household services (+3.2%), transportation and storage (+1.4%) and accommodation and food services activities (+1.6%). It increased more moderately in real estate activities (+0.7%).
Output grew sharply over a year
In services, output of the last three months grew sharply over a year (+4.9%), with an increase in all sectors but real estate activities.
It went up strongly in business support (+4.9%), be it in administrative and business service activities (+6.0%) or in specialised, scientific and technical activities (+4.0%). It grew sharply in information and communication (+7.4%), household services (+7.8%), food and beverage services activities (+6.4%) and transportation and storage (+3.2%).
By contrast, it decreased in real estate activities (−0.6%).
graphiqueGraph1 – Index of services production
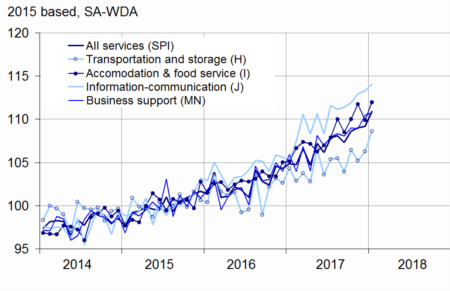
- Sources: DGFiP, INSEE
tableauTable1 – Variation in the services production
| Change in % | |||||
|---|---|---|---|---|---|
| Nace classification | Weight (1) | Jan./ Dec. | Dec./ Nov. | q-o-q (2) | y-o-y (3) |
| Index of services production | 10000 | 1.6 | 0.1 | 1.6 | 4.9 |
| H Transportation and storage | 1504 | 2.2 | 1.0 | 1.4 | 3.2 |
| I Accommodation and food service activities | 870 | 1.9 | –1.7 | 1.6 | 6.4 |
| J Information and communication | 1635 | 0.7 | 0.3 | 1.7 | 7.4 |
| L Real estate activities | 964 | 5.1 | –2.4 | 0.7 | –0.6 |
| M+N Business support | 4289 | 0.3 | 1.4 | 1.4 | 4.9 |
| M Specialised, scientific and technical activities | 2540 | –0.3 | 1.1 | 0.9 | 4.0 |
| N Administrative and business service activities | 1748 | 1.1 | 1.9 | 2.2 | 6.0 |
| R+S Household services | 738 | 5.6 | –4.1 | 3.2 | 7.8 |
- (1) Weight (10 000 = H…S excepting K, O, P, Q)
- (2) Quarter-on-quarter: last three months / previous three months
- (3) Year-on-year: last three months / same three months of previous year
- Sources: DGFiP, INSEE
Strong rebound in household services
After a downturn in December, output in household services bounced back sharply in January (+5.6% after −4.1%). The rebound is stronger in arts, entertainment and recreation (+6.5% after −5.5%) than in “other personal services” (+3.9% after −1.4%).
Further increase in transportation and storage
In January 2018, output in transportation and storage rose again (+2.2% after +1.0% in December). The output increased again in land transport (+3.6% after +1.3%) and in warehousing and support for transportation (+0.9% after +2.3%). By contrast, it diminished in postal and courrier activities (−5.9% after −0.4%).
Significant recover in accommodation and food service activities
After a fall in December, output in accommodation and food services picked up in January (+1.9% after −1.7%). The upturn is more marked in food and beverage service activities (+2.4% after −1.4%) than in accommodation (+0.2% after −2.5%).
Slight grow in business support
Output in business support activities rose again in January 2018 (+0.3% after +1.4%).
It increased in administrative and business support activities (+1.1% after +1.9%), notably in rental and leasing activities (+1.9%), employment activities (+0.7%) and other administrative and business support activities (+1.1%).
By contrast, the output dwindled in specialised, scientific and technical activities (−0.3% after +1.1%), particularly in scientific research and development (−2.2%), legal and accounting activities (−0.6%) and activities of head offices and management consultancy (−0.4%).
Further rise in information and communication
In January, output in information and communication went up again (+0.7% after +0.3%), held up by motion picture, sound recording and music publishing (+6.7%) and publishing activities (+1.8%). Conversely, it declined in programming and broadcasting activities (−4.1%).
tableauTable2 – Variation in the services production
| Change in % | |||||
|---|---|---|---|---|---|
| Weight (1) | Jan. 18 | Jan./ Dec. | Dec./ Nov. | q-o-q (2) | |
| Index of services production | 10000 | 110.9 | 1.6 | 0.1 | 1.6 |
| H transportation and storage | 1504 | 108.6 | 2.2 | 1.0 | 1.4 |
| 49 Land transport… | 715 | 112.5 | 3.6 | 1.3 | 2.5 |
| 50 Water transport | 36 | 124.3 | 16.1 | –12.2 | –5.6 |
| 51 Air transport | 115 | 103.3 | 3.4 | 0.0 | 0.0 |
| 52 Warehousing and support for transportation | 504 | 108.8 | 0.9 | 2.3 | 2.0 |
| 53 Postal and courier activities | 135 | 88.2 | –5.9 | –0.4 | –4.5 |
| I Accommodation and food service activities | 870 | 112.0 | 1.9 | –1.7 | 1.6 |
| 55 Accommodation | 205 | 105.1 | 0.2 | –2.5 | 2.9 |
| 56 Food and beverage service activities | 664 | 114.1 | 2.4 | –1.4 | 1.2 |
| J Information-communication | 1635 | 114.1 | 0.7 | 0.3 | 1.7 |
| 58 Publishing activities | 208 | 109.9 | 1.8 | –0.3 | 1.6 |
| 59 Motion picture, sound recording, music publishing | 119 | 113.1 | 6.7 | –2.4 | 3.0 |
| 60 Programming and broadcasting activities | 71 | 104.3 | –4.1 | –0.3 | 3.8 |
| 61 Telecommunications | 415 | 98.7 | 0.4 | –1.5 | –0.1 |
| 62 Computer programming... | 720 | 123.4 | 0.1 | 1.6 | 2.2 |
| 63 Information services | 102 | 126.8 | 0.2 | 1.9 | 2.2 |
| L Real estate activities | 964 | 104.2 | 5.1 | –2.4 | 0.7 |
| M Specialised, scientific and technical activities | 2540 | 107.1 | –0.3 | 1.1 | 0.9 |
| 69 Legal and accounting activities | 502 | 112.3 | –0.6 | 1.9 | 1.7 |
| 70 Activities of head offices and management consultancy | 739 | 108.4 | –0.4 | 1.4 | 0.6 |
| 71 Architecture and engineering activities | 491 | 106.9 | 1.7 | 1.8 | 1.8 |
| 72 Scientific research and development | 559 | 99.3 | –2.2 | –0.7 | –0.6 |
| 73 Advertising and market research | 146 | 103.1 | –0.2 | 2.3 | 3.3 |
| 74 Other professional, scientific and technical activities | 79 | 123.6 | 0.4 | –0.2 | –1.1 |
| 75 Veterinary activities | 26 | 110.9 | 3.6 | –2.7 | –0.3 |
| N Administrative and business service activities | 1748 | 116.1 | 1.1 | 1.9 | 2.2 |
| 77 Rental and leasing activities | 526 | 113.3 | 1.9 | –0.7 | 0.5 |
| 78 Employment activities | 502 | 128.7 | 0.7 | 5.3 | 5.0 |
| 79 Travel agency, tour operator | 35 | 104.5 | –0.5 | 0.8 | 1.3 |
| 80 Security and investigation | 104 | 112.9 | 2.4 | 0.0 | 1.6 |
| 81 Services to building and landscape anctivities | 245 | 110.5 | –0.3 | 1.7 | 0.2 |
| 82 Other administrative and business support activities | 336 | 107.9 | 1.1 | 1.2 | 2.2 |
| R Arts, entertainment and recreation | 460 | 122.3 | 6.5 | –5.5 | 4.4 |
| S Other personal services | 278 | 107.7 | 3.9 | –1.4 | 0.9 |
- (1) Weight (10 000 = H…S excepting K, O, P, Q)
- (2) Quarter-on-quarter: last three months / previous three months
- Sources: DGFiP, INSEE
Rebasing and reference change to 2015
Services production indices are rebased every 5 years. From now on, they have reference year 2015, which means that they have for average 100 in 2015. The 2015 rebasing implements an innovation, with the introduction of a two-weighting system (instead of a constant-weight system) in order to better take into account the structural evolutions. This change responds to a recommandation of Eurostat in order to increase the robustness of indices over a long period. The methodological information concerning these base year and reference changes are available on the INSEE Website.
Pour en savoir plus
