


 23 February 2018
2018- n° 50In December 2017, services output increased slightly (+0.2%) Index of services production - December 2017
23 February 2018
2018- n° 50In December 2017, services output increased slightly (+0.2%) Index of services production - December 2017
In December 2017, services output increased slightly (+0.2%) after a virtual stability in November (+0.1%).

Please note: In accordance with European directives, the index of services production and the associated turnover indicators will use 2015 as base year from the publication of the index of January 2018, due on March 30, 2018.
In December 2017, services output increased slightly (+0.2%) after a virtual stability in November (+0.1%).
Services output increased over the last three months
Over the last three months (October to December), services output rose by 1.0% compared to the previous three months.
It grew in business support (+1.3%), information and communication (+1.2%), household services (+3.7%) and accommodation and food service activities (+1.5%). It decreased in transportation and storage (−0.1%) and real estate activities (−1.0%).
Output grew sharply over a year
In services, the output of the last three months rose sharply year on year (+5.1%), with an increase in all sectors.
Output went up strongly in business support (+5.8%), be it in administrative and business service activities (+6.1%) or in specialised, scientific and technical activities (+5.5%). It also grew sharply in information and communication (+6.4%), accommodation and food service activities (+6.3%), transportation and storage (+2.8%) and household services (+5.8%). It increased more slightly in real estate activities (+1.3%).
graphiqueGraph1 – Index of services production
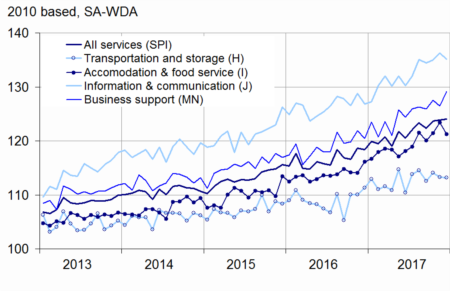
- Sources: DGFiP, INSEE
tableauTable1 – Variation in the services production
| Change in % | |||||
|---|---|---|---|---|---|
| Nace classification | Weight (1) | Dec./ Nov. | Nov./ Oct. | q-o-q (2) | y-o-y (3) |
| Index of services production | 10000 | 0.2 | 0.1 | 1.0 | 5.1 |
| H Transportation and storage | 1601 | 0.0 | –0.7 | –0.1 | 2.8 |
| I Accommodation and food service activities | 926 | –1.7 | 1.6 | 1.5 | 6.3 |
| J Information and communication | 1745 | –0.8 | 0.9 | 1.2 | 6.4 |
| L Real estate activities | 1064 | –1.4 | –0.1 | –1.0 | 1.3 |
| M+N Business support | 4020 | 2.1 | –0.8 | 1.3 | 5.8 |
| M Specialised, scientific and technical activities | 2210 | 1.8 | –1.1 | 1.4 | 5.5 |
| N Administrative and business service activities | 1810 | 2.4 | –0.4 | 1.3 | 6.1 |
| R+S Household services | 644 | –3.3 | 3.7 | 3.7 | 5.8 |
- (1) Weight (10 000 = H…S excepting K, O, P, Q)
- (2) Quarter-on-quarter: last three months / previous three months
- (3) Year-on-year: last three months / same three months of previous year
- Sources: DGFiP, INSEE
Rebound in business support
After a decline in November, output in business support activities bounced back in December 2017 (+2.1% after −0.8%).
It rose sharply in administrative and business support activities (+2.4% after −0.4%). It increased in almost all sub-sectors, especially in employment activities (+5.5%).
Output also bounced back in specialised, scientific and technical activities (+1.8% after −1.1%), especially in activities of head offices and management consultancy (+1.8%), legal and accounting activities (+2.1%) and architecture and engineering activities (+1.8%).
Stability in transportation and storage
In December 2017, output flattened out in transportation and storage after a decline of 0.7% in November. Output bounced back in warehousing and support for transportation (+2.3% after −0.8%) and land transport (+0.3% after −0.5%). By contrast, it fell back in air transport (−1.5% after +1.6%).
Decrease in household services
After two consecutive months of increase, output in household services fell back in December (−3.3% after +3.7%). The decline was more marked in the arts, entertainment and recreation sector (−5.2% after +6.6%) than in “other personal services” (−1.1% after +0.6%).
Downturn in accomodation and food service activities
After an increase in November, output in accommodation and food services fell back in December (−1.7% after +1.6%). Both sectors were affected by the decline : –1.3% in food and beverage service activities and −3.3% in accommodation.
Decrease in information and communication
Output in information and communication decreased in December (−0.8% after +0.9%), mainly in telecommunications (−4.3%) and motion picture, sound recording, music publishing (−3.8%). By contrast, output increased in computer programming (+1.6%).
Revisions
The month-on-month variation rate of the index of services production in November 2017 has been revised upwards by 0.2 points. Initially published at −0.1%, it has been stated at +0.1%.
tableauTable2 – Variation in the services production
| Change in % | |||||
|---|---|---|---|---|---|
| Weight (1) | Dec. 17 | Dec./ Nov. | Nov./ Oct. | q-o-q (2) | |
| Index of services production | 10000 | 124.1 | 0.2 | 0.1 | 1.0 |
| H transportation and storage | 1601 | 113.2 | 0.0 | –0.7 | –0.1 |
| 49 Land transport… | 686 | 118.3 | 0.3 | –0.5 | 1.2 |
| 50 Water transport | 63 | 183.4 | –11.6 | –0.4 | –8.2 |
| 51 Air transport | 129 | 97.6 | –1.5 | 1.6 | –3.1 |
| 52 Warehousing and support for transportation | 563 | 113.9 | 2.3 | –0.8 | 0.8 |
| 53 Postal and courier activities | 161 | 74.4 | –0.3 | –4.9 | –1.1 |
| I Accomodation and food service activities | 926 | 121.2 | –1.7 | 1.6 | 1.5 |
| 55 Accommodation | 211 | 112.8 | –3.3 | 3.7 | 3.3 |
| 56 Food and beverage service activities | 715 | 123.7 | –1.3 | 1.0 | 1.0 |
| J Information-communication | 1745 | 135.2 | –0.8 | 0.9 | 1.2 |
| 58 Publishing activities | 220 | 105.3 | –0.4 | 0.6 | 1.8 |
| 59 Motion picture, sound recording, music publishing | 124 | 119.7 | –3.8 | 2.4 | 1.0 |
| 60 Programming and broadcasting activities | 68 | 134.9 | 2.5 | 7.3 | 6.2 |
| 61 Telecommunications | 558 | 129.5 | –4.3 | 0.7 | –1.4 |
| 62 Computer programming... | 683 | 148.2 | 1.6 | 0.6 | 2.5 |
| 63 Information services | 92 | 165.4 | 2.3 | –0.4 | 2.4 |
| L Real estate activities | 1064 | 106.0 | –1.4 | –0.1 | –1.0 |
| M Specialised, scientific and technical activities | 2210 | 124.3 | 1.8 | –1.1 | 1.4 |
| 69 Legal and accounting activities | 496 | 124.2 | 2.1 | 0.0 | 1.3 |
| 70 Activities of head offices and management consultancy | 665 | 127.9 | 1.8 | –0.8 | 1.2 |
| 71 Architecture and engineering activities | 465 | 124.1 | 1.8 | –2.3 | 2.5 |
| 72 Scientific research and development | 313 | 107.1 | 2.3 | –1.9 | –0.2 |
| 73 Advertising and market research | 171 | 114.0 | 1.6 | –0.6 | 1.7 |
| 74 Other professional, scientific and technical activities | 71 | 190.1 | –0.4 | –1.1 | 1.5 |
| 75 Veterinary activities | 29 | 128.9 | –0.6 | –1.2 | 0.9 |
| N Administrative and business service activities | 1810 | 135.1 | 2.4 | –0.4 | 1.3 |
| 77 Rental and leasing activities | 545 | 130.4 | 0.8 | 1.0 | –1.4 |
| 78 Employment activities | 512 | 148.1 | 5.5 | –1.5 | 2.9 |
| 79 Travel agency, tour operator | 45 | 116.2 | –0.4 | –0.7 | 2.3 |
| 80 Security and investigation | 109 | 128.0 | 0.1 | –0.9 | 2.0 |
| 81 Services to building and landscape anctivities | 248 | 127.6 | 1.7 | –1.9 | 2.9 |
| 82 Other administrative and business support activities | 351 | 133.2 | 1.5 | 0.1 | 1.4 |
| R Arts, entertainment and recreation | 306 | 135.5 | –5.2 | 6.6 | 6.5 |
| S Other personal services | 338 | 112.2 | –1.1 | 0.6 | 0.8 |
- (1) Weight (10 000 = H…S excepting K, O, P, Q)
- (2) Quarter-on-quarter: last three months / previous three months
- Sources: DGFiP, INSEE
tableauTable3 – Revision of variations
| Nov./ Oct. | Oct./ Sept. | Sept./ Aug. | Q3 2017/ Q2 2017 | 2016/ 2015 | |
|---|---|---|---|---|---|
| Services production | 0.21 | 0.30 | –0.07 | 0.08 | –0.01 |
| Raw series | 0.23 | 0.34 | –0.05 | 0.11 | –0.02 |
| SA-WDA parameters | –0.02 | –0.04 | –0.02 | –0.03 | 0.01 |
- How to read: in the services industries, the SA-WDA variation in output between October and November 2017 is revised by +0.21 points: +0,23 points due to the revisions of raw data and -0,02 points due to the update of SA-WDA parameters.
- Sources: DGFiP, INSEE
Documentation
Pour en savoir plus
