


 30 November 2017
2017- n° 318In September 2017, the turnover in the manufacturing industry rose slightly (+0.2%) Turnover in industry and construction - September 2017
30 November 2017
2017- n° 318In September 2017, the turnover in the manufacturing industry rose slightly (+0.2%) Turnover in industry and construction - September 2017
In September 2017, the turnover rose slightly in the manufacturing industry (+0.2 % after +0.4% in August). It recovered in export (+0.6% after −0.3%).
In industry as a whole, the turnover was virtually stable in September (+0.1% after +0.5% in August).
- Sharp increase on the third quarter (+1.2%)
- Strong growth compared to the previous year (+6.3%)
- Sharp rebound in transport equipment (+3.8%)
- Sharp increase in coke and refined petroleum products (+5.7%)
- Downturn in food products and beverages (−1.6%)
- Moderate decrease in “other manufacturing” (−0.5%)
- Contraction in machinery and equipment (−1.1%)
- Revisions

The commentary shows variations of subsections by decreasing contribution to the overall evolution. The contribution of a subsection depends on the extent of the change and on its weight.
In September 2017, the turnover rose slightly in the manufacturing industry (+0.2 % after +0.4% in August). It recovered in export (+0.6% after −0.3%).
In industry as a whole, the turnover was virtually stable in September (+0.1% after +0.5% in August).
Sharp increase on the third quarter (+1.2%)
Over the third quarter, the turnover rose sharply in the manufacturing industry (+1.2%) as in industry as a whole (+1.3%). In the manufacturing industry, the turnover grew strongly in the manufacture of transport equipment (+3.5%). It rose also in “other manufacturing” (+0.8%), in the machinery and equipment goods (+1.9%) and in the manufacture of food products and beverages (+0.4%). Conversely, it fell in the manufacture of coke and refined petroleum products (−1.5%).
Strong growth compared to the previous year (+6.3%)
In the manufacturing industry, the turnover rose sharply from the same three months of the previous year (+6.3%). This growth was also marked in industry as a whole (+7.1%) due to the strong increase in the mining and quarrying, energy, water supply, waste management (+11.2%). Over this period, the turnover rose sharply in every main sectors of the manufacturing industry − “other manufacturing” (+6.0%), the manufacture of transport equipment (+8.3%), the manufacture of food products and beverages (+4.2%), the machinery and equipment sector (+6.2%) and the manufacture of coke and refined petroleum products (+10.7%).
graphiqueGraph1 – Turnover in manufacturing industry
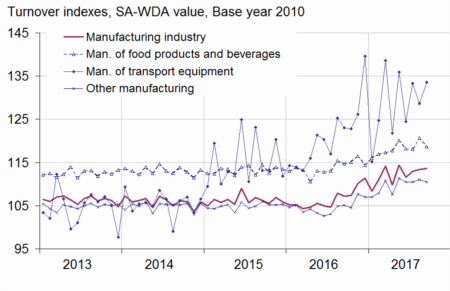
- Sources: DGFiP, INSEE
tableauTable1 – Variation of the turnover in industry and construction
| Change in % | |||||
|---|---|---|---|---|---|
| NA : A 10, (A 17) | Weight (1) | Sept./ Aug. | Aug./ July | q-o-q (2) | y-o-y (3) |
| BE: INDUSTRY | 10000 | 0.1 | 0.5 | 1.3 | 7.1 |
| CZ: MANUFACTURING INDUSTRY | 8346 | 0.2 | 0.4 | 1.2 | 6.3 |
| Of which Exports | 2677 | 0.6 | −0.3 | 1.5 | 7.2 |
| (C1): Manufacture of food products and beverages | 1685 | −1.6 | 2.1 | 0.4 | 4.2 |
| (C2): Manufacture of coke and refined petroleum products | 561 | 5.7 | −0.2 | −1.5 | 10.7 |
| (C3): Machinery and equipment goods | 953 | −1.1 | 2.7 | 1.9 | 6.2 |
| (C4): Manufacture of transport equipment | 1265 | 3.8 | −3.5 | 3.5 | 8.3 |
| (C5): Other manufacturing | 3881 | −0.5 | 0.6 | 0.8 | 6.0 |
| DE: Mining and quarrying; energy; water supply; waste management | 1654 | −0.4 | 0.9 | 1.6 | 11.2 |
| FZ: CONSTRUCTION | 10000 | −0.6 | 3.1 | −0.1 | 6.7 |
- (1) 10000=B...E and F
- (2) Quarter-on-quarter: last three months / previous three months
- (3) Year-on-year: last three months / same three months of previous year
- The codes correspond to different levels of aggregation of the french aggregated classification of activites (NA 2008).
- Sources: DGFiP, INSEE
Sharp rebound in transport equipment (+3.8%)
The turnover in the manufacture of transport equipment recovered sharply in September (+3.8% after −3.5% in August). This rebound was driven by the manufacture of other transport equipment (+4.7% after −4.8%) and the manufacture of motor vehicles, trailers and semi-trailers (+2.8% after −2.0%). It was also very marked in export sales (+6.8% after −6.9%).
Sharp increase in coke and refined petroleum products (+5.7%)
The turnover in the manufacture of coke and refined petroleum products bounced back sharply in September (+5.7% after −0.2% in August).
Downturn in food products and beverages (−1.6%)
In September, the turnover in the manufacture of food products and beverages fell back (−1.6% after +2.1% in August). It also slipped back in export sales (−2.2% after +2.9%).
Moderate decrease in “other manufacturing” (−0.5%)
The turnover in “other manufacturing” edged down in September (−0.5% after +0.6% in August). It fell again in the manufacture of chemicals and chemical products (−1.5% after −2.6%). It decreased in the manufacture of textiles (−1.6%) after a stability in August. It fell back in the manufacture of basic metals and fabricated metal products, except machinery and equipement (−0.7% after 1.1%) as well as in the manufacture of rubber and plastic products (−0.3% after +1.2%) and in the manufacture of wood and paper products (−0.7% after +1.5%). Conversely, it rose again in the manufacture of basic pharmaceutical products and pharmaceutical preparations (+1.6% after +2.4%) and to a lesser extent in the other manufacturing (+0.2% after +1.3%). In export sales, the turnover fell back in “other manufacturing” (−1.2% after +2.1%).
Contraction in machinery and equipment (−1.1%)
In September, the turnover in machinery and equipment slipped back (−1.1% after +2.7%). It fell back sharply in the manufacture of electrical equipment (−2.9% after +5.5%) and to a lesser extent in the manufacture of computer, electronic and optical products (−0.7% after +2.1%) and in the manufacture of other machinery and equipment (−0.3% after +1.6%). The turnover in machinery and equipment also fell back in export sales (−1.9% after +1.4%).
Revisions
The variation in the turnover index in August 2017 has been raised by 0.1 points in the manufacturing industry, at 0.4% instead of 0.3%, and in industry as a whole, at 0.5% instead of 0.4%.
tableauTable2 – Indices of turnover in industry and construction
| Change in % | |||||
|---|---|---|---|---|---|
| Industries: | Weight (1) | Sept. 2017 | Sept./ Aug. | Aug./ July | q-o-q (2) |
| BE: INDUSTRY | 10000 | 116.4 | 0.1 | 0.5 | 1.3 |
| CZ: MANUFACTURING INDUSTRY | 8346 | 113.6 | 0.2 | 0.4 | 1.2 |
| of which Exports | 2677 | 120.7 | 0.6 | –0.3 | 1.5 |
| (C1): Man. of food products and beverages | 1685 | 118.7 | –1.6 | 2.1 | 0.4 |
| of which Exports | 285 | 125.4 | –2.2 | 2.9 | −0.7 |
| (C2): Man. of coke and refined petroleum products | 561 | 78.8 | 5.7 | −0.2 | −1.5 |
| (C3): Machinery and equipment goods | 953 | 110.9 | −1.1 | 2.7 | 1.9 |
| of which Exports | 469 | 108.1 | −1.9 | 1.4 | 1.7 |
| [CI] Man. of computer, electronic and optical products | 306 | 109.8 | −0.7 | 2.1 | 3.5 |
| [CJ] Man. of electrical equipment | 245 | 103.6 | −2.9 | 5.5 | 1.0 |
| [CK] Man. of machinery and equipment n.e.c. | 402 | 116.2 | −0.3 | 1.6 | 1.2 |
| (C4): Man. of transport equipment | 1265 | 133.6 | 3.8 | −3.5 | 3.5 |
| of which Exports | 617 | 140.0 | 6.8 | −6.9 | 2.2 |
| [CL1] Man. of motor vehicles, trailers and semi-trailers | 702 | 111.2 | 2.8 | −2.0 | 2.8 |
| [CL2] Man. of other transport equipment | 562 | 161.6 | 4.7 | −4.8 | 4.1 |
| (C5): Other manufacturing | 3881 | 110.5 | −0.5 | 0.6 | 0.8 |
| of which Exports | 1237 | 116.2 | −1.2 | 2.1 | 1.1 |
| [CB] Man. of textiles, wearing apparel, leather and related products | 188 | 111.6 | −1.6 | 0.0 | 0.5 |
| [CC] Man. of wood and paper products; printing and reproduction of recorded media | 436 | 100.6 | −0.7 | 1.5 | 0.8 |
| [CE] Man. of chemicals and chemical products | 745 | 106.2 | −1.5 | −2.6 | 0.8 |
| [CF] Man. of basic pharmaceutical products and pharmaceutical preparations | 304 | 118.3 | 1.6 | 2.4 | 0.5 |
| [CG] Man. of rubber and plastics products, and other non-metallic mineral products | 629 | 108.9 | −0.3 | 1.2 | 0.8 |
| [CH] Man. of basic metals and fabricated metal products, except machinery and equipment | 926 | 109.4 | −0.7 | 1.1 | 1.4 |
| [CM] Other manufacturing; repair and installation of machinery and equipment | 653 | 121.2 | 0.2 | 1.3 | 0.3 |
| DE: Mining and quarrying; energy, water supply, sewerage, waste management | 1654 | 130.5 | −0.4 | 0.9 | 1.6 |
| [BZ] Mining and quarrying | 70 | 95.1 | 1.5 | 1.0 | −0.3 |
| [DZ] Electricity, gas, steam and air-conditioning supply | 1205 | 134.9 | −0.8 | 1.2 | 1.2 |
| [EZ] Water supply; sewerage, waste management and remediation | 379 | 122.7 | 0.8 | 0.0 | 3.2 |
| FZ: CONSTRUCTION | 10000 | 111.3 | −0.6 | 3.1 | −0.1 |
- (1) 10000=B...E and F
- (2) Quarter-on-quarter: last three months / previous three months
- Sources: DGFiP, INSEE
tableauTable3 – Revision of variations
| Aug./ July | July/ June | June/ May | Q2 2017/ Q1 2017 | 2016/ 2015 | |
|---|---|---|---|---|---|
| Industry (BE) | 0.02 | 0.22 | 0.02 | 0.02 | 0.00 |
| raw serie | 0.00 | 0.19 | −0.08 | −0.02 | 0.00 |
| SA-WDA parameters | 0.02 | 0.03 | 0.10 | 0.04 | 0.00 |
| Manufacturing industry (CZ) | 0.05 | 0.26 | 0.03 | 0.06 | 0.00 |
| raw serie | −0.10 | 0.22 | −0.10 | −0.02 | 0.00 |
| SA-WDA parameters | 0.15 | 0.04 | 0.13 | 0.08 | 0.00 |
- How to read it: in the manufacturing, the SA-WDA variation between July and August 2017 is revised by +0.05 points: −0.10 points are due to the raw series' revision and +0.15 points to the new calculation of the SA-WDA.
- Sources: DGFiP, INSEE
Documentation
Methodology (pdf,140 Ko)
Pour en savoir plus
Time series : Turnover indices (VAT)
