


 25 August 2017
2017- n° 222Acceleration in business start-ups in July 2017 Enterprise births - July 2017
25 August 2017
2017- n° 222Acceleration in business start-ups in July 2017 Enterprise births - July 2017
In July 2017, the number of business births for all entreprises speeded up (+4.9% after +3.0% in June, seasonally and working-day adjusted). Micro-entrepreneurs' registrations soared (+11.6% after +4.5%). However start-ups excluding self-managed micro-entrepreneurs slowed down (+0.5% after +1.9%).
In July 2017, the number of business births for all entreprises speeded up (+4.9% after +3.0% in June, seasonally and working-day adjusted). Micro-entrepreneurs' registrations soared (+11.6% after +4.5%). However start-ups excluding self-managed micro-entrepreneurs slowed down (+0.5% after +1.9%).
graphiqueGraph1 – Business start-ups (SA-WDA *)
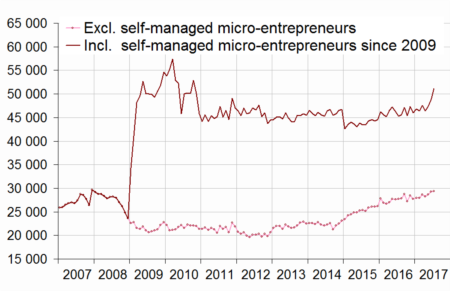
- * Seasonally and working-day adjusted data
- Source: INSEE (Sirene)
tableauTable1 – Business set-ups by month (SA-WDA *)
| April 2017 | May 2017 | June 2017 | July 2017 | |
|---|---|---|---|---|
| Excl. self-managed micro-entrepreneurs | 28,281 | 28,668 | 29,225 | 29,365 |
| Variation [m-o-m] % | -1.3 | 1.4 | 1.9 | 0.5 |
| Incl. self-managed micro-entrepreneurs | 46,439 | 47,354 | 48,753 | 51,153 |
| Variation [m-o-m] % | -2.2 | 2.0 | 3.0 | 4.9 |
- * Seasonally and working-day adjusted data
- Source: INSEE (Sirene)
+4.9% year on year (three months basis)
Compared to the same period one year before, the raw amount of births added up in the second quarter rose sharply (+4.9% in raw data). Micro-entrepreneurs' registrations bounced back (+6.7% after −4.8%) and company births kept increasing at a sustained pace (+5.6%). Sole proprietorship start-ups excluding micro-entrepreneurs went up too (+1.3%). Business support activities and transportation were the sectors that contributed the most to the overall rise1.

1 The contribution of a sector to the overall variation is the variation observed in this sector, weighted by the share of this sector in the total number of births.
tableauTable2 – Cumulated business start-ups by type
| Moving total % change * | Moving total | Moving total | ||
|---|---|---|---|---|
| over 3 months | over 12 months | January- July 2017 | January- July 2016 | |
| Total | 4.9 | 3.7 | 344,186 | 332,927 |
| Companies | 5.6 | 5.8 | 120,723 | 114,792 |
| Sole proprietorships (SP) | 4.5 | 2.7 | 223,463 | 218,135 |
| SP excluding self-managed micro-entrepreneurs | 1.3 | 4.9 | 88,554 | 86,148 |
| Self-managed micro-entrepreneurs | 6.7 | 1.3 | 134,909 | 131,987 |
- * Total of business start-ups during the last 3 or 12 months compared with the same months a year earlier
- Source: INSEE (Sirene)
+3.7% over the last twelve months
The raw number of business start-ups totted up during the last twelve months kept growing (+3.7% year on year after +2.4%). This rise was mostly due to company births (+5.8%) and sole proprietorship start-ups excluding self-managed micro-entrepreneurs (+4.9%). Moreover, micro-entrepreneurs' registrations bounced back (+1.3% after −1.1%).
A little less than two business set-ups out of five are self-managed micro-entrepreneurs' registrations
In July 2017, the share of micro–entrepreneurs' registrations in the businesses set up over the last twelve months amounted to 39.9%. One year before, it was 40.9%.
tableauTable0 – Business set-ups distribution by type
| May 2017 | June 2017 | July 2017 | |
|---|---|---|---|
| Companies | 34.5 | 34.5 | 34.5 |
| Sole proprietorships excluding self-managed micro-entrepreneurs | 25.9 | 25.8 | 25.6 |
| Self-managed micro-entrepreneurs | 39.7 | 39.7 | 39.9 |
- Source: INSEE (Sirene)
Revisions
The variation in the overall number of business births in July 2017 has been raised by 0.1 points to +3.0% due to the revision of raw data and the update of the SA-WDA parameters.
Business set-ups by economic activity
graphiqueGraph2 – Trade and business support activities start-ups (SA-WDA *)

- * Seasonally and working-day adjusted data
- Source: INSEE (Sirene)
graphiqueGraph3 – Construction and transportation business set-ups (SA-WDA *)
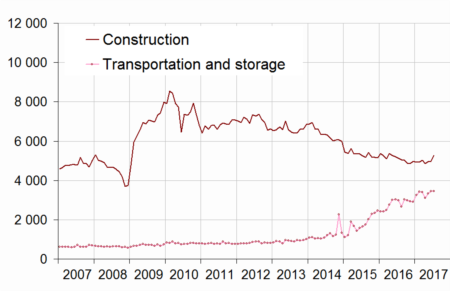
- * Seasonally and working-day adjusted data
- Source: INSEE (Sirene)
tableauTable3 – Number of business set-ups (incl. self-managed micro-entrepreneurs)
| NA | May 2017 | June 2017 | July 2017 | |
|---|---|---|---|---|
| Total | 47,354 | 48,753 | 51,153 | |
| Industry | BE | 1,978 | 2,015 | 2,168 |
| Of which Manufacturing | C | 1,746 | 1,744 | 1,904 |
| Construction | FZ | 4,950 | 4,986 | 5,282 |
| Wholesale and retail trade, Transport, Accommodation and Food and beverage activities | GI | 13,715 | 14,198 | 14,458 |
| Trade | G | 7,847 | 8,112 | 8,309 |
| Transportation and storage | H | 3,335 | 3,450 | 3,442 |
| Accommodation and food service activities | I | 2,532 | 2,636 | 2,707 |
| Information and communication | JZ | 2,339 | 2,438 | 2,580 |
| Financial and insurance activities | KZ | 1,268 | 1,337 | 1,395 |
| Real estate activities | LZ | 1,772 | 1,888 | 1,968 |
| Business support activities | MN | 11,279 | 11,635 | 12,678 |
| Public administration and defence, education, human health and social work activities | OQ | 5,925 | 5,918 | 5,922 |
| Other services activities | RS | 4,128 | 4,339 | 4,702 |
- * Seasonally and working-day adjusted data
- Source: INSEE (Sirene)
tableauTable4 – Fluctuation in the number of business set-ups (incl. self-managed micro-entrepreneurs)
| NA | July 17 / June 17 | Moving total % change** | ||
|---|---|---|---|---|
| SA-WDA * | over 3 months | over 12 months | ||
| Total | 4.9 | 4.9 | 3.7 | |
| Industry | BE | 7.6 | -1.5 | 0.0 |
| Of which Manufacturing | C | 9.2 | -0.8 | -1.7 |
| Construction | FZ | 6.0 | -4.1 | -5.3 |
| Wholesale and retail trade, Transport, Accommodation and Food and beverage activities | GI | 1.8 | 2.8 | 4.3 |
| Trade | G | 2.4 | -0.1 | -2.6 |
| Transportation and storage | H | -0.2 | 12.5 | 26.4 |
| Accommodation and food service activities | I | 2.7 | 1.4 | 4.6 |
| Information and communication | JZ | 5.8 | 5.6 | 5.1 |
| Financial and insurance activities | KZ | 4.4 | 1.5 | 2.8 |
| Real estate activities | LZ | 4.2 | 18.0 | 10.9 |
| Business support activities | MN | 9.0 | 13.6 | 7.8 |
| Public administration and defence, education, human health and social work activities | OQ | 0.1 | 2.5 | 5.0 |
| Other services activities | RS | 8.4 | 4.3 | 0.3 |
- * Seasonally and working-day adjusted data
- ** Total of business start-ups during the last 3 or 12 months compared with the same months a year earlier
- Source: INSEE (Sirene)
Pour en savoir plus
Time series : Business demography
