


 22 June 2017
2017- n° 164In June 2017, the business climate in manufacturing is virtually stable significantly
above normal Monthly business survey (goods-producing industries) - June 2017
22 June 2017
2017- n° 164In June 2017, the business climate in manufacturing is virtually stable significantly
above normal Monthly business survey (goods-producing industries) - June 2017
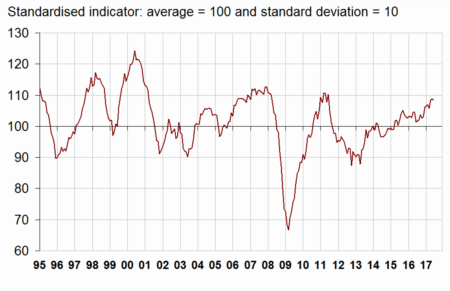
According to the business managers surveyed in June 2017, the business climate in industry is virtually stable. At 108, it is significantly above its long-term average (100).
- The balance of opinion about general production expectations has reached its highest level since June 2007
- Slight sectoral variations offset each other
- In the manufacture of food products and beverages, the business climate has improved and has returned to its highest level since July 2011
- In the manufacture of machinery and equipment goods, the business climate has decreased by one point after having reached its highest level since March 2008
- The business climate remains above normal in the manufacture of transport equipment
- In “other manufacturing”, the business climate has slightly improved
According to the business managers surveyed in June 2017, the business climate in industry is virtually stable. At 108, it is significantly above its long-term average (100).
graphiqueGraph 1 – Business climate in industry - Composite indicator
The turning-point indicator remains in the zone indicating a favourable economic outlook.
graphiqueGraph 2 – Turning-point indicator
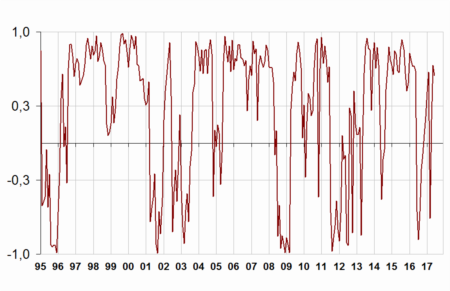
- How to read it: close to 1 (respectively −1), the indicator points to a favourable short-term economic situation (respectively unfavourable). Between −0.3 and +0.3: uncertainty area.
The balance of opinion about general production expectations has reached its highest level since June 2007
In June 2017, the balance of industrialists' opinion on their past activity has declined further, that on personal production expectations has also fell back. However, both remain significantly above their normal level.
Furthermore, business managers are much more upbeat than in May on general production prospects for the sector. The corresponding balance has improved further and has reached its highest level since June 2007, significantly above its long-term average.
In June 2017, their opinion on global order books has slightly improved while that on export order books is unchanged. The corresponding balances are significantly above normal.
Finally, almost as industrialists as in May consider that finished-goods inventories are below normal: the corresponding balance remains below its long-term average.
tableauTable 1 – Industrialists' opinion on manufacturing activity
| Manufacturing industry | Ave.* | March 17 | April 17 | May 17 | June 17 |
|---|---|---|---|---|---|
| Composite indicator | 100 | 106 | 108 | 109 | 108 |
| Past activity | 5 | 9 | 17 | 14 | 10 |
| Finished-goods inventory | 13 | 7 | 6 | 5 | 6 |
| Global order books | –18 | –9 | –6 | –5 | –3 |
| Export order books | –14 | –5 | –1 | –2 | –2 |
| Personal production expectations | 5 | 11 | 12 | 16 | 13 |
| General production expectations | –9 | 3 | 1 | 7 | 17 |
- * Long-term average since 1976.
- Source: INSEE - Monthly business tendency survey in industry

Warning: In the survey of June 2017, the weights used to aggregate the responses of the business managers have been updated. The seasonal coefficients as well as the parameters of the composite indicator have also been updated. As a result, the set of results previously published in this survey is subject to slight revisions.
Slight sectoral variations offset each other
In June, the virtual stability in the business climate in industry especially comes from a slight decrease in machinery and equipment, offset by an improvement in food products and beverages and in “other manufacturing”.
In the manufacture of food products and beverages, the business climate has improved and has returned to its highest level since July 2011
In June, with a rise of 7 points in two months, the business climate in the manufacture of food products and beverages has returned to its highest level since July 2011. At 111, it is significantly above normal. All balances of opinion have contributed to this improvement, in particular that on past activity, which has bounced back.
In the manufacture of machinery and equipment goods, the business climate has decreased by one point after having reached its highest level since March 2008
In the manufacture of machinery and equipment goods, after having reached its highest level since March 2008, the business climate has decreased by one point but remains, at 109, significantly above normal. This slight decrease comes mainly from a decline in the balances of opinion on past activity and on export order books, which still remain far above normal.
In the computer, electronic and optical product industry as in machinery and equipment, the business climate has slightly decreased. However, it is stable at its highest level since June 2011 in electrical equipment.
The business climate remains above normal in the manufacture of transport equipment
In the manufacture of transport equipment, the business climate is stable at 105, above its long-term average. On the one hand the balance on past activity has recovered, on the other hand those on personal production expectations and on global order books have diminished.
The business climate is stable in the manufacture of motor vehicles, trailers and semi-trailers while it has slightly increased in other transport equipment.
In “other manufacturing”, the business climate has slightly improved
In overall “other manufacturing”, the business climate has increased by one point and has returned to its highest level since June 2011 (108), significantly above normal. This slight improvement comes from a further increase in the balances on order books and on general production expectations. It is partly offset by a decrease in those on personal expectations and past activity.
The business climate has sharply recovered in wood-paper and has reached a ten-year high. It has improved in rubber and plastic products and in basic metals to its highest level since more than six years. It has slightly increased in chemicals. However, it has fallen again in clothing-textiles. It is virtually stable in “other manufacturing industries”.
graphiqueGraph 3 – Business climates in a sector-based approach
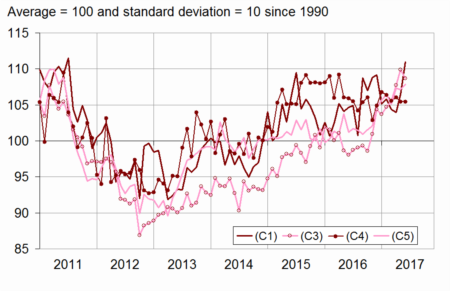
- Legend: (C1): Manufacture of food products and beverages - (C3): Machinery and equipment goods - (C4): Manufacture of transport equipment - (C5): Other manufacturing
tableauTable 2 – Business climates in a sector-based approach
| NA* : (A17) et [A38 et A64] | Weights** (%) | April 17 | May 17 | June 17 |
|---|---|---|---|---|
| (C1) Man. of food products and beverages | 22 | 104 | 106 | 111 |
| (C3) Machinery and equipment goods | 11 | 108 | 110 | 109 |
| [CI] Computer, electronic and optical products | 3 | 110 | 115 | 113 |
| [CJ] Electrical equipment | 3 | 105 | 106 | 106 |
| [CK] Machinery and equipment | 5 | 106 | 108 | 107 |
| (C4) Man. of transport equipment | 15 | 106 | 105 | 105 |
| [CL1] Motor vehicles, trailers and semi-trailers | 7 | 106 | 106 | 106 |
| [CL2] Other transport equipment | 8 | 104 | 103 | 104 |
| (C5) Other manufacturing | 46 | 107 | 107 | 108 |
| [CB] Textiles, clothing industries, leather and footwear industry | 2 | 110 | 104 | 101 |
| [CC] Wood, paper, printing | 5 | 106 | 105 | 111 |
| [CE] Chemicals and chemical products | 9 | 111 | 107 | 108 |
| [CG] Rubber and plastic products | 7 | 108 | 108 | 110 |
| [CH] Basic metals and fabricated metal products | 11 | 103 | 105 | 107 |
| [CM] Other manufacturing industries | 9 | 101 | 102 | 101 |
- * NA: aggregated classification, based on the French classification of activities NAF rév.2.
- ** Weights used to aggregate sub-sector's balances of opinion.
- Source: INSEE - Monthly business tendency survey in industry
Documentation
Methodology (pdf,133 Ko)
Pour en savoir plus
Time series : Industry - Activity and demand
