


 28 April 2017
2017- n° 118In February 2017, the turnover recovered in the manufacturing industry (+1.7%) Turnover in industry and construction - February 2017
28 April 2017
2017- n° 118In February 2017, the turnover recovered in the manufacturing industry (+1.7%) Turnover in industry and construction - February 2017
In February 2017, the turnover bounced back in the manufacturing industry (+1.7% after −3.3% in January). The turnover of export sales rose modestly (+0.4 %) after a very large decline in January (−9.0%).
In industry as a whole, the turnover recovered as well (+2.8% after −2.3%).
- Increase over the last three months (+1.5%)
- Sharp growth over a year (+4.2%)
- Rebound in transport equipment (+7.1%)
- Increase in “other manufacturing” (+0.7%)
- Further increase in food products and beverages (+1.0%)
- Coke and refined petroleum products continue to grow (+3.3%)
- Contraction in machinery and equipment (−0.8%)
- Revisions

The commentary shows variations of subsections by decreasing contribution to the overall evolution. The contribution of a subsection depends on the extent of the change and on its weight.
In February 2017, the turnover bounced back in the manufacturing industry (+1.7% after −3.3% in January). The turnover of export sales rose modestly (+0.4 %) after a very large decline in January (−9.0%).
In industry as a whole, the turnover recovered as well (+2.8% after −2.3%).
Increase over the last three months (+1.5%)
Over the last three months, the turnover rose steeply in the manufacturing industry (+1.5% compared to the previous three months) as well as in industry as a whole (+2.6%). It grew in most sectors of the manufacturing industry: “other manufacturing” (+1.0%), manufacture of transport equipment (+2.7%), manufacture of coke and refined petroleum products (+9.2%), machinery and equipment goods (+1.0%). It was steady in the manufacture of food products and beverages.
Sharp growth over a year (+4.2%)
Over one year, the turnover of the last three months grew sharply in the manufacturing industry (+4.2%). The growth was even more marked in industry as a whole (+6.3%), thanks to a sharp increase in the mining and quarrying, energy, water supply, waste management sector (+16.1%). Over this period, the turnover rose in every main sector of the manufacturing industry. The increase was particulary strong in the manufacture of transport equipment (+11.7%) and the manufacture of coke and refined petroleum products (+21.6%). It was more moderate in the “other manufacturing” (+1.7%), the manufacture of food products and beverages (+1.8%) and the machinery and equipment industry (+1.6%).
graphiqueGraph1 – Turnover in manufacturing industry
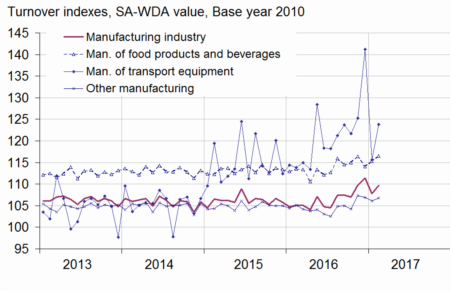
- Sources: DGFiP, INSEE
tableauTable1 – Variation of the turnover in industry and construction
| Change in % | |||||
|---|---|---|---|---|---|
| NA : A 10, (A 17) | Weight* | Feb./ Jan. | Jan./ Dec. | q-o-q (1) | y-o-y (2) |
| BE: INDUSTRY | 10000 | 2.8 | −2.3 | 2.6 | 6.3 |
| CZ: MANUFACTURING INDUSTRY | 8346 | 1.7 | −3.3 | 1.5 | 4.2 |
| Of which Exports | 2677 | 0.4 | −9.0 | 3.5 | 6.0 |
| (C1): Manufacture of food products and beverages | 1685 | 1.0 | 1.1 | 0.0 | 1.8 |
| (C2): Manufacture of coke and refined petroleum products | 561 | 3.3 | 2.9 | 9.2 | 21.6 |
| (C3): Machinery and equipment goods | 953 | −0.8 | 1.5 | 1.0 | 1.6 |
| (C4): Manufacture of transport equipment | 1265 | 7.1 | −18.1 | 2.7 | 11.7 |
| (C5): Other manufacturing | 3881 | 0.7 | −0.7 | 1.0 | 1.7 |
| DE: Mining and quarrying; energy; water supply; waste management | 1654 | 7.4 | 1.9 | 7.9 | 16.1 |
| FZ: CONSTRUCTION | 10000 | −0.5 | 1.5 | 0.8 | 2.7 |
- **10000=B...E and F
- (1) Quarter-on-quarter: last three months / previous three months
- (2) Year-on-year : last three months / same three months of previous year
- The codes correspond to different levels of aggregation of the french aggregated classification of activities (NA 2008).
- Sources: DGFiP, INSEE
Rebound in transport equipment (+7.1%)
The turnover in the manufacture of transport equipment recovered sharply in February 2017 (+7.1% after −18.1% in January). This rebound was due to the the manufacture of other transport equipment (+13.6% after −30.1%), while the manufacture of motor vehicles changed little on the last two months (+0.4% after −0.6%). The turnover of export sales recovered slightly (+1.8%) after a slump in January (−27.9%).
Increase in “other manufacturing” (+0.7%)
In February, the turnover in “other manufacturing” recovered (+0.7% after −0.7% in January). It bounced back especially in the manufacture of rubber, plastics, and other non-metallic mineral products (+3.4% after −2.1%). The turnover rose in the manufacture of basic metals and fabricated metal products (+0.3% after a stability) and in the manufacture of chemicals and chemical products (+1.1% after −0.8%). Conversely, it fell back in pharmaceuticals (−0.2% after +3.1%) and in manufacture of textiles, wearing apparel, leather and related products (−0.7% after +0.5%). In “other manufacturing”, the export sales recovered modestly (+0.9% after −0.2%).
Further increase in food products and beverages (+1.0%)
In February, the turnover rose clearly again in the manufacture of food products and beverages (+1.0% after +1.1%), despite a downturn in export sales (−2.1% after +1.1%).
Coke and refined petroleum products continue to grow (+3.3%)
The turnover in the manufacture of coke and refined petroleum products rose sharply again in February (+3.3% after +2.9%).
Contraction in machinery and equipment (−0.8%)
The turnover in machinery and equipment fell back in February (−0.8% after +1.5%). It shrank sharply in the manufacture of computer, electronic and optical products (−1.9% after +3.3%) and fell again in the manufacture of electrical equipment (−1.2% as in January). Conversely, it rose again a little in the manufacture of other machinery and equipment (+0.2% after +1.7%). In machinery and equipment, export sales for fell back slightly (−0.3% after +0.5%).
Revisions
In the manufacturing industry, the variation in turnover is unchanged at −3.3% for January 2017. It has been raised by 0.6 points in industry as a whole, to −2.3% instead of −2.9% previously because of the integration of late information in the energy sector.
tableauTable2 – Indexes of turnover in industry and construction
| Change in % | |||||
|---|---|---|---|---|---|
| Industries: | Weight* | Feb. 2017 | Feb./ Jan. | Jan./ Dec. | q-o-q (1) |
| BE: INDUSTRY | 10000 | 114.1 | 2.8 | −2.3 | 2.6 |
| CZ: MANUFACTURING INDUSTRY | 8346 | 109.7 | 1.7 | −3.3 | 1.5 |
| of which Exports | 2677 | 114.3 | 0.4 | −9.0 | 3.5 |
| (C1): Man. of food products and beverages | 1685 | 116.5 | 1.0 | 1.1 | 0.0 |
| of which Exports | 285 | 117.9 | −2.1 | 1.1 | −0.4 |
| (C2): Man. of coke and refined petroleum products | 561 | 81.9 | 3.3 | 2.9 | 9.2 |
| (C3): Machinery and equipment goods | 953 | 106.8 | −0.8 | 1.5 | 1.0 |
| of which Exports | 469 | 104.5 | −0.3 | 0.5 | 0.8 |
| [CI] Man. of computer, electronic and optical products | 306 | 107.9 | −1.9 | 3.3 | 3.6 |
| [CJ] Man. of electrical equipment | 245 | 98.9 | −1.2 | −1.2 | −0.4 |
| [CK] Man. of machinery and equipment n.e.c. | 402 | 110.7 | 0.2 | 1.7 | −0.1 |
| (C4): Man. of transport equipment | 1265 | 123.8 | 7.1 | −18.1 | 2.7 |
| of which Exports | 617 | 130.0 | 1.8 | −27.9 | 11.8 |
| [CL1] Man. of motor vehicles, trailers and semi-trailers | 702 | 103.1 | 0.4 | −0.6 | 0.9 |
| [CL2] Man. of other transport equipment | 562 | 149.6 | 13.6 | −30.1 | 4.1 |
| (C5): Other manufacturing | 3881 | 106.8 | 0.7 | −0.7 | 1.0 |
| of which Exports | 1237 | 110.3 | 0.9 | −0.2 | 0.2 |
| [CB] Man. of textiles, wearing apparel, leather and related products | 188 | 108.7 | −0.7 | 0.5 | −1.7 |
| [CC] Man. of wood and paper products; printing and reproduction of recorded media | 436 | 96.7 | 0.3 | −1.1 | −0.5 |
| [CE] Man. of chemicals and chemical products | 745 | 104.9 | 1.1 | −0.8 | 2.1 |
| [CF] Man. of basic pharmaceutical products and pharmaceutical preparations | 304 | 114.0 | −0.2 | 3.1 | 4.0 |
| [CG] Man. of rubber and plastics products, and other non-metallic mineral products | 629 | 106.0 | 3.4 | −2.1 | 0.5 |
| [CH] Man. of basic metals and fabricated metal products, except machinery and equipment | 926 | 103.5 | 0.3 | 0.0 | 1.4 |
| [CM] Other manufacturing; repair and installation of machinery and equipment | 653 | 117.5 | −0.7 | −1.9 | 0.2 |
| DE: Mining and quarrying; energy, water supply, sewerage, waste management | 1654 | 136.3 | 7.4 | 1.9 | 7.9 |
| [BZ] Mining and quarrying | 70 | 98.9 | 6.9 | −4.9 | 4.1 |
| [DZ] Electricity, gas, steam and air-conditioning supply | 1205 | 144.2 | 8.6 | 3.9 | 9.6 |
| [EZ] Water supply; sewerage, waste management and remediation | 379 | 118.2 | 3.2 | −3.9 | 2.6 |
| FZ: CONSTRUCTION | 10000 | 106.4 | −0.5 | 1.5 | 0.8 |
- ** 10000=B...E and F
- (1) Quarter-on-quarter: last three months / previous three months
- Sources: DGFiP, INSEE
tableauTable3 – Revision of variations
| Jan./ Dec. | Dec./ Nov. | Nov./ Oct. | Q4 2016/ Q3 2016 | 2016/ 2015 | |
|---|---|---|---|---|---|
| Industry (BE) | 0.58 | 0.13 | 0.11 | 0.23 | 0.02 |
| raw serie | 0.82 | 0.09 | 0.00 | 0.04 | 0.02 |
| SA-WDA parameters | −0.24 | 0.04 | 0.11 | 0.19 | 0.00 |
| Manufacturing industry (CZ) | 0.02 | 0.15 | 0.04 | 0.10 | 0.02 |
| raw serie | −0.02 | 0.11 | 0.00 | 0.05 | 0.02 |
| SA-WDA parameters | 0.05 | 0.04 | 0.05 | 0.05 | 0.00 |
- How to read it: in the manufacturing, the SA-WDA variation between December 2016 and January 2017 is revised by +0.02 points: −0.02 points are due to the raw series' revision and +0.05 points to the new calculation of the SA-WDA parameters.
- Sources: DGFiP, INSEE
Documentation
Methodology (pdf,140 Ko)
Pour en savoir plus
Time series : Turnover indices (VAT)
