


 28 April 2017
2017- n° 120In February 2017, services output fell back (−0.7%) Index of services production - February 2017
28 April 2017
2017- n° 120In February 2017, services output fell back (−0.7%) Index of services production - February 2017
In February 2017, output fell back in services (−0.7%) after a rise in January (+1.0%).

The commentary shows variations of subsections by decreasing contribution to the overall variation. The contribution of a subsection depends on the extent of the change and on its weight.
In February 2017, output fell back in services (−0.7%) after a rise in January (+1.0%).
Services output rose markedly over the last three months
Over the past three months, services production increased by 1.5% compared to the previous three months.
It grew by 1.3% in business support activities, in specialised, scientific and technical activitiesas well as in administrative and business service activities. It rose sharply in transportation and storage (+3.4%), real estate activities (+1.9%), and household services (+3.4%). It also grew in accomodation and food service activities (+1.7%). By contrast, it declined in information and communication (−0.5%).
Output grew markedly over a year
In services, output of the last three months rose sharply year on year (+2.6%), with an increase in all sectors.
It went up significantly in business support (+3.2%), notably in administrative and business service activities (+5.0%). It grew sharply in real estate activities (+4.6%). It also rose in transportation and storage (+2.1%), information and communication (+1.4%), food and beverage service activities (+2.7%), and more moderately in household services (+0.6%).
graphiqueGraph1 – Index of services production
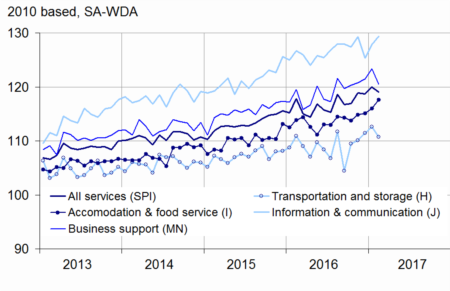
- Sources: DGFiP, INSEE
tableauTable1 – Variation in services production
| Change in % | |||||
|---|---|---|---|---|---|
| Nace classification | Weight * | Feb./ Jan. | Jan./ Dec. | q-o-q (1) | y-o-y (2) |
| Index of services production | 10000 | −0.7 | 1.0 | 1.5 | 2.6 |
| H Transportation and storage | 1601 | −1.7 | 1.0 | 3.4 | 2.1 |
| I Accomodation and food service activities | 926 | 1.4 | 0.8 | 1.7 | 2.7 |
| J Information and communication | 1745 | 1.2 | 2.0 | −0.5 | 1.4 |
| L Real estate activities | 1064 | −0.2 | −2.5 | 1.9 | 4.6 |
| M+N Business support | 4020 | −2.3 | 1.5 | 1.3 | 3.2 |
| M Specialised, scientific and technical activities | 2210 | −2.8 | 2.7 | 1.3 | 1.6 |
| N Administrative and business service activities | 1810 | −1.7 | 0.2 | 1.3 | 5.0 |
| R+S Household services | 644 | 2.2 | 0.5 | 3.4 | 0.6 |
- *Weight (10 000 = H…S excepting K, O, P, Q)
- (1) Quarter-on-quarter: last three months / previous three months
- (2) Year-on-year: last three months / same three months of previous year
- Sources: DGFiP, INSEE Downturn in business support
In February 2017, output in business support activities fell back sharply (−2.3% after +1.5% in January).
It shrank significantly in specialised, scientific and technical activities (−2.8% after +2.7% in January), particularly in activities of head offices and management consultancy (−3.8%) and architecture and engineering activities (−4.2%). By contrast, it bounced back in other specialised, scientific and technical activities (+3.8%).
Output fell back also in administrative and business support activities (−1.7% after +0.2%), notably in rental and leasing activities (−2.5%) and employment activities (−1.8%).
Drop in transportation and storage
Output in transportation and storage fell back in February (−1.7% after +1.0% in January). In particular, it decreased sharply in warehousing and support for transportation (−3.4%) and air transport (−9.3%). By contrast, it bounced back considerably in water transport (+14.6%).
Further rise in information and communication
In February, output in information and communication rose again (+1.2%) after a significant upturn in January (+2.0%). It grew in telecommunications (+2.8%). It bounced back in motion picture production, sound recording and music publishing activities (+3.3%) and rose sharply in information services (+3.5%). By contrast, it declined markedly in programming and broadcasting activities (−4.7%).
Acceleration in accomodation and food service activities
In February, output gathered pace in accomodation and food service activities (+1.4% after +0.8%). It rose both in food and beverage service activities (+1.4%) and accomodation (+1.3%).
Revisions
The monthly variation rate of the index of services production in January 2017 has been revised downwards by 0.1 points, mainly due to the update of raw data. Initially published at +1.1%, it has been stated at +1.0%.
tableauTable2 – Variation in services production
| Changes in % | |||||
|---|---|---|---|---|---|
| Weight * | Feb. 17 | Feb./ Jan. | Jan./ Dec. | q-o-q (1) | |
| Index of services production | 10000 | 119.0 | −0.7 | 1.0 | 1.5 |
| H transportation and storage | 1601 | 110.7 | −1.7 | 1.0 | 3.4 |
| 49 Land transport… | 686 | 115.2 | −1.0 | 2.2 | 2.1 |
| 50 Water transport | 63 | 209.4 | 14.6 | −2.3 | 28.2 |
| 51 Air transport | 129 | 93.5 | −9.3 | −2.0 | 1.7 |
| 52 Warehousing and support for transportation | 563 | 108.2 | −3.4 | 1.0 | 2.3 |
| 53 Postal and courier activities | 161 | 75.9 | −3.6 | 0.3 | −0.6 |
| I Accomodation and food service activities | 926 | 117.6 | 1.4 | 0.8 | 1.7 |
| 55 Accomodation | 211 | 109.9 | 1.3 | 1.8 | 2.9 |
| 56 Food and beverage service activities | 715 | 119.9 | 1.4 | 0.5 | 1.4 |
| J Information-communication | 1745 | 129.4 | 1.2 | 2.0 | −0.5 |
| 58 Publishing activities | 220 | 100.5 | 1.4 | −1.3 | −0.7 |
| 59 Motion picture, sound recording, music publishing | 124 | 116.8 | 3.3 | −3.7 | 1.2 |
| 60 Programming and broadcasting activities | 68 | 120.8 | −4.7 | −0.5 | −0.6 |
| 61 Telecommunications | 558 | 138.3 | 2.8 | 6.4 | −2.0 |
| 62 Computer programming... | 683 | 132.0 | −0.3 | 0.6 | 0.1 |
| 63 Information services | 92 | 147.9 | 3.5 | 1.3 | 1.3 |
| L Real estate activities | 1064 | 108.0 | −0.2 | −2.5 | 1.9 |
| M Specialised, scientific and technical activities | 2210 | 117.4 | −2.8 | 2.7 | 1.3 |
| 69 Legal and accounting activities | 496 | 117.8 | −1.6 | 3.4 | 1.6 |
| 70 Activities of head offices and management consultancy | 665 | 118.0 | −3.8 | 1.7 | 1.1 |
| 71 Architecture and engineering activities | 465 | 121.9 | −4.2 | 4.6 | 5.3 |
| 72 Scientific research and development | 313 | 100.0 | −2.5 | 2.7 | −1.9 |
| 73 Advertising and market research | 171 | 110.7 | −3.4 | 3.1 | −2.4 |
| 74 Other professional, scientific and technical activities | 71 | 167.5 | 3.8 | −2.4 | −2.1 |
| 75 Veterinary activities | 29 | 125.3 | 0.7 | 0.0 | −0.9 |
| N Administrative and business service activities | 1810 | 124.3 | −1.7 | 0.2 | 1.3 |
| 77 Rental and leasing activities | 545 | 120.6 | −2.5 | −2.6 | 0.2 |
| 78 Employment activities | 512 | 130.7 | −1.8 | 3.9 | 2.9 |
| 79 Travel agency, tour operator | 45 | 118.5 | −0.2 | 5.2 | 2.8 |
| 80 Security and investigation | 109 | 124.1 | −0.4 | 1.1 | 0.0 |
| 81 Services to building and landscape anctivities | 248 | 120.1 | −0.8 | −0.8 | 1.6 |
| 82 Other administrative and business support activities | 351 | 124.6 | −1.5 | −1.2 | 0.5 |
| R Arts, entertainment and recreation | 306 | 133.7 | 3.9 | 0.5 | 4.8 |
| S Other personal services | 338 | 112.6 | 0.4 | 0.5 | 1.9 |
- *Weight (10 000 = H…S excepting K, O, P, Q)
- (1) Quarter-on-quarter: last three months / previous three months
- Sources: DGFiP, INSEE
tableauTable3 – Revision of variations
| Jan. / Dec. | Dec. / Nov. | Nov. / Oct. | Q4 2016 / Q3 2016 | 2016 / 2015 | |
|---|---|---|---|---|---|
| Services production | –0.12 | 0.05 | 0.04 | 0.01 | 0.01 |
| Raw series | –0.18 | –0.07 | –0.01 | –0.02 | 0.02 |
| SA-WDA parameters | 0.06 | 0.12 | 0.05 | 0.03 | –0.01 |
- How to read: in the services industries, the SA-WDA output variation between January 2017 and December 2016 is revised by 0.12 points: -0.18 points due to the revisions of raw data and +0.06 points due the the update of SA-WDA parameters
- Sources: DGFiP, INSEE
Documentation
Pour en savoir plus
