


 31 January 2017
2017- n° 32In November 2016, the turnover recovered sharply in the manufacturing industry (+2.4%) Turnover in industry and construction - November 2016
31 January 2017
2017- n° 32In November 2016, the turnover recovered sharply in the manufacturing industry (+2.4%) Turnover in industry and construction - November 2016
In November 2016, the turnover recovered sharply in the manufacturing industry (+2.4% after −0.4% in October). The rebound was slightly more marked in exports (+2.7% after −0.9%).
In the industry as a whole, the turnover picked up sharply too (+2.7% after −0.3%).
- Sharp increase over the last three months (+2.1%)
- Strong growth compared to the previous year (+1.7%)
- Significant rise in “other manufacturing” (+2.6%)
- Strong rebound in machinery and equipment goods (+4.5%)
- Recovery in transport equipment (+2.9%)
- Further increase in food products and beverages (+1.3%)
- Downturn in coke and refined petroleum products (−1.6%)
- Revisions:

Warning
Turnover indices (total and exports) have been recalculated in the building of ships and floating structures to take better into account exceptional deliveries of ocean liners in 2016.
The result is unusual revisions in the shipbuilding sector but also by aggregation in manufacture of other transport equipment and in the manufacturing industry.
- - - - - - - - - - - - - - - - - - - - - - - -
Every index in this issue is in value (tax excluded), seasonally and working day adjusted.
The commentary shows variations of subsections by decreasing contribution. The contribution of a subsection depends on the extent of the change and on its weight.
In November 2016, the turnover recovered sharply in the manufacturing industry (+2.4% after −0.4% in October). The rebound was slightly more marked in exports (+2.7% after −0.9%).
In the industry as a whole, the turnover picked up sharply too (+2.7% after −0.3%).
Sharp increase over the last three months (+2.1%)
Over the last three months, the turnover rose sharply in the manufacturing industry as well as in the industry as a whole (+2.1%). It grew in every sector of the manufacturing industry: “other manufacturing” (+1.8%), manufacture of transport equipment (+2.4%), manufacture of food products and beverages (+1.7%), manufacture of coke and refined petroleum products (+7.7%) and machinery and equipment goods (+1.4%).
Strong growth compared to the previous year (+1.7%)
The turnover of the last three months grew sharply compared to the same three months of the previous year in the manufacturing industry (+1.7%), as in the industry as a whole (+2.1%). Over this period, it rose markedly in the manufacture of transport equipment (+6.9%) and more modestly in the manufacture of food products and beverages (+1.6%), that of machinery and equipment goods (+1.5%) and the manufacture of coke and refined petroleum products (+1.2%). It was virtually stable in the “other manufacturing” sector (+0.1%).
graphiqueGraph1 – Turnover in manufacturing industry
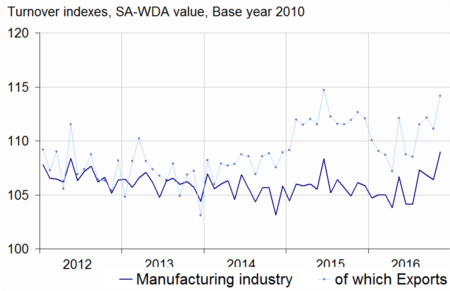
- Source: INSEE
graphiqueGraph2 – Turnover in manufacturing industry by sector
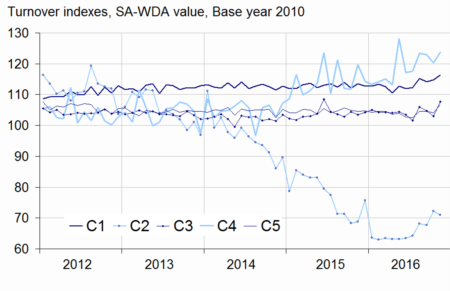
- Source: INSEE
tableauTable1 – Variation of the turnover in industry and construction
| Change in % | |||||
|---|---|---|---|---|---|
| NA : A 10, (A 17) | Weight* | Nov./ Oct. | Oct./ Sep. | q-o-q (1) | y-o-y (2) |
| BE: INDUSTRY | 10000 | 2.7 | –0.3 | 2.1 | 2.1 |
| CZ: MANUFACTURING INDUSTRY | 8346 | 2.4 | –0.4 | 2.1 | 1.7 |
| Of which Exports | 2677 | 2.7 | –0.9 | 2.6 | 0.4 |
| (C1): Manufacture of food products and beverages | 1685 | 1.3 | 0.5 | 1.7 | 1.6 |
| (C2): Manufacture of coke and refined petroleum products | 561 | –1.6 | 6.6 | 7.7 | 1.2 |
| (C3): Machinery and equipment goods | 953 | 4.5 | –1.6 | 1.4 | 1.5 |
| (C4): Manufacture of transport equipment | 1265 | 2.9 | –2.2 | 2.4 | 6.9 |
| (C5): Other manufacturing | 3881 | 2,6 | –0.5 | 1.8 | 0.1 |
| DE: Mining and quarrying; energy; water supply; waste management | 1654 | 4.0 | 0.0 | 2.2 | 3.6 |
| FZ: CONSTRUCTION | 10000 | 1.3 | 0.0 | 3.0 | 1.3 |
- * 10000=B...E and F
- (1) Quarter-on-quarter: last three months / previous three months
- (2) Year-on-year: last three months / same three months of previous year
- The codes correspond to different levels of aggregation of the NACE classification.
- Source: INSEE
Significant rise in “other manufacturing” (+2.6%)
The turnover in “other manufacturing” strongly recovered in November (+2.6%) after a decrease in October (−0.5%). The increase was mainly due to the manufacture of chemicals and chemicals products (+4.5%), the manufacture of rubber and plastics products, and other non-metallic mineral products (+3.8%) and the manufacture of basic pharmaceutical products and pharmaceutical preparations (+4.1%).
Strong rebound in machinery and equipment goods (+4.5%)
The turnover in machinery and equipment goods bounced back vigorously in November (+4.5%) after two months of significant decline (−1.6% in October and −1.2% in September). It recovered in the manufacture of machinery and equipment n.e.c. (+4.6%) and the manufacture of computer, electronic and optical products (+6.1%). It went on increasing in the manufacture of electrical equipment (+2.5%).
Recovery in transport equipment (+2.9%)
The turnover in the manufacture of transport equipment recovered strongly in November (+2.9% after −2.2% in October), thanks to the manufacture of other transport equipment (+4.3% after −7.4% in October). The turnover in the manufacture of motor vehicles, trailers and semi-trailers rose again (+1.5%), even if it was at a lower pace than in October (+4.5%).
Further increase in food products and beverages (+1.3%)
In November, the turnover accelerated in the manufacture of food products and beverages (+1.3% after +0.5% in October).
Downturn in coke and refined petroleum products (−1.6%)
In November, the turnover fell back in the manufacture of coke and refined petroleum products (−1.6%) after a sharp increase in October (+6.6%).
Revisions:
In the manufacturing industry, the variation in turnover is unchanged at −0.4% for October 2016. It has been lowered by 0.1 points in the industry as a whole (−0.3% instead of −0.2% previously).
tableauTable2 – Indexes of turnover in industry and construction
| Change in % | |||||
|---|---|---|---|---|---|
| Industries: | Weight | Nov. 2016 | Nov./ Oct. | Oct./ Sep. | q-o-q (1) |
| BE: INDUSTRY | 10000 | 111.0 | 2.7 | −0.3 | 2.1 |
| CZ: MANUFACTURING INDUSTRY | 8346 | 109.0 | 2.4 | −0.4 | 2.1 |
| of which Exports | 2677 | 114.2 | 2.7 | −0.9 | 2.6 |
| (C1): Man. of food products and beverages | 1685 | 116.3 | 1.3 | 0.5 | 1.7 |
| of which Exports | 285 | 119.9 | 1.1 | −0.4 | 2.3 |
| (C2): Man. of coke and refined petroleum products | 561 | 71.0 | −1.6 | 6.6 | 7.7 |
| (C3): Machinery and equipment goods | 953 | 107.7 | 4.5 | −1.6 | 1.4 |
| of which Exports | 469 | 105.4 | 3.5 | 0.1 | 1.2 |
| [CI] Man. of computer, electronic and optical products | 306 | 106.2 | 6.1 | −4.4 | −1.1 |
| [CJ] Man. of electrical equipment | 245 | 102.6 | 2.5 | 0.6 | 3.7 |
| [CK] Man. of machinery and equipment n.e.c. | 402 | 111.9 | 4.6 | −0.7 | 2.0 |
| (C4): Man. of transport equipment | 1265 | 123.8 | 2.9 | −2.2 | 2.4 |
| of which Exports | 617 | 124.9 | 0.6 | −3.9 | 2.1 |
| [CL1] Man. of motor vehicles, trailers and semi-trailers | 702 | 103.1 | 1.5 | 4.5 | −1.7 |
| [CL2] Man. of other transport equipment | 562 | 149.6 | 4.3 | −7.4 | 6.2 |
| (C5): Other manufacturing | 3881 | 106.8 | 2.6 | −0.5 | 1.8 |
| of which Exports | 1237 | 112.6 | 5.6 | −1.3 | 2.9 |
| [CB] Man. of textiles, wearing apparel, leather and related products | 188 | 113.1 | 2.9 | 0.9 | 0.9 |
| [CC] Man. of wood and paper products; printing and reproduction of recorded media | 436 | 98.8 | 2.8 | −0.5 | 1.1 |
| [CE] Man. of chemicals and chemical products | 745 | 104.5 | 4.5 | −1.3 | 3.4 |
| [CF] Man. of basic pharmaceutical products and pharmaceutical preparations | 304 | 111.5 | 4.1 | 0.0 | −2.2 |
| [CG] Man. of rubber and plastics products, and other non-metallic mineral products | 629 | 106.0 | 3.8 | −1.3 | 1.5 |
| [CH] Man. of basic metals and fabricated metal products, except machinery and equipment | 926 | 102.4 | 0.9 | 1.1 | 2.7 |
| [CM] Other manufacturing; repair and installation of machinery and equipment | 653 | 117.8 | 1.1 | −1.6 | 2.1 |
| DE: Mining and quarrying; energy, water supply, sewerage, waste management | 1654 | 121.3 | 4.0 | 0.0 | 2.2 |
| [BZ] Mining and quarrying | 70 | 92.7 | 3.6 | −1.8 | 0.1 |
| [DZ] Electricity, gas, steam and air-conditioning supply | 1205 | 124.0 | 3.3 | 0.2 | 2.4 |
| [EZ] Water supply; sewerage, waste management and remediation | 379 | 117.9 | 6.5 | −0.2 | 2.0 |
| FZ: CONSTRUCTION | 10000 | 105.4 | 1.3 | 0.0 | 3.0 |
- (1) Quarter-on-quarter: last three months / previous three months
- Source: INSEE
tableauTable3 – Revisions of variations
| Oct./ Sept. | Sept./ Aug. | Aug./ July | Q3 2016/ Q2 2016 | 2015/ 2014 | |
|---|---|---|---|---|---|
| Industry (BE) | −0.12 | 0.04 | −0.01 | 0.81 | 0.04 |
| raw serie | −0.45 | −0.01 | 0.12 | 1.74 | 0.03 |
| SA-WDA parameters | 0.33 | 0.05 | −0.13 | −0.92 | 0.01 |
| Manufacturing industry (CZ) | −0.04 | −0.01 | −0.04 | 0.90 | 0.04 |
| raw serie | −0.30 | −0.01 | 0.12 | 2.10 | 0.03 |
| SA-WDA parameters | 0.26 | 0.00 | −0.16 | −1.20 | 0.01 |
- How to read it: in manufacturing, the SA-WDA variation between September 2016 and October 2016 is revised by −0.04 points: −0.30 points are due to the raw serie's revision and 0.26 points to the new calculation of the SA-WDA parameters.
- Source: INSEE
Documentation
Methodology (pdf,140 Ko)
Pour en savoir plus
Time series : Turnover indices (VAT)
