


 16 November 2016
2016- n° 298In October 2016, oil price increased sharply Prices of oil and raw material imports - October 2016
16 November 2016
2016- n° 298In October 2016, oil price increased sharply Prices of oil and raw material imports - October 2016
In October 2016, the price in euros of crude oil increased sharply (+9.6% after +0.1%) to stand at 45.1€ on average per barrel. The price of Brent crude is higher than a year before (+5.37%). The prices in euros of the other imported commodities bounced back (+1.8%), after two months of decline (−1.2% in September and −2.0% in August): the prices of industrial raw materials picked up (+3.0% after −1.3%) and those of raw food materials almost stabilised(−0.1% after −1.0%).
In October 2016, the price in euros of crude oil increased sharply (+9.6% after +0.1%) to stand at 45.1€ on average per barrel. The price of Brent crude is higher than a year before (+5.37%). The prices in euros of the other imported commodities bounced back (+1.8%), after two months of decline (−1.2% in September and −2.0% in August): the prices of industrial raw materials picked up (+3.0% after −1.3%) and those of raw food materials almost stabilised(−0.1% after −1.0%).
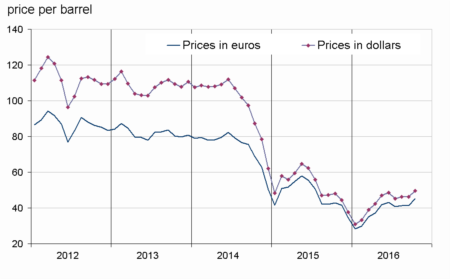
Oil price increased significantly
In October, the price in euros of crude oil from the North Sea (Brent) increased sharply (+9.6% after +0.1%), following the OPEP announcement about a potential agreement to reduce production. Expressed in dollars, the price rise was slightly less marked (+7.7% after +0.1%) because the euro depreciated a little during the month.
graphiqueG_petrole_ang – Oil (Brent)
- Source: INSEE
tableautabpetrole – Oil and petroleum products
| Prices | Change (%) | |||
|---|---|---|---|---|
| of last month | over the last month | over the last 3 months | over the last 12 months | |
| Brent in $ per barrel | 49.7 | 7.7 | 10.3 | 3.3 |
| Brent in € per barrel | 45.1 | 9.6 | 10.8 | 5.4 |
| Gasoline €/L | 0.365 | 7.8 | 12.2 | 17.9 |
| Gas Oil | 420.1 | 12.5 | 14.7 | 3.0 |
| Heavy fuel | 264.6 | 7.3 | 21.7 | 17.0 |
| Naphtha | 398.9 | 14.3 | 14.6 | 2.8 |
- Prices are in euros per tonne unless otherwise specified
- Source : INSEE
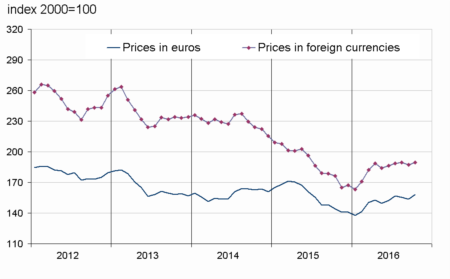
Industrial commodity prices picked up
The prices in euros of industrial raw materials bounced back in October (+3.0% after −1.3%). Minerals prices recovered (+3.0% after −1.3%). The price of iron ore picked up (+4.2% after −6.3%); the prices of non-ferrous metals also went up (+3.4% after +0.0%). In contrast, the prices of precious metals declined for the third month in a row (−4.7% after −0.8%). The prices of agricultural raw materials also bounced back (+3.0% after −1.2%), particulary for sawn softwood (+3.4% after −3.8%) and natural rubber (+9.1% after 2.3%).
graphiqueG_indus_ang – Industrial raw materials
- Source: INSEE
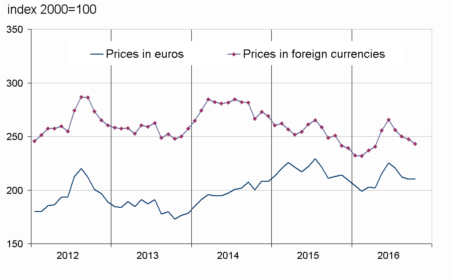
Raw food material prices held steady
Expressed in euros, the prices of raw food materials remained practically stable (−0.1%), after three months of decline (−1.0% in September). Cereal prices recovered (+1.8% after −3.8%), as the corn price rose sharply (+8.1% after +1.8%). Tropical foodstuff prices bounced back (+0.7% after −0.3%): arabica and robusta prices kept increasing, wich offset a further decline in cacao price. The price of sugar increased strongly again (+9.2% after +6.6%), buoyed by weak harvests in Bresil. The decline in beef meat price eased (−1.0% after −6.3%), as the milk world price has recovered. In contrast, the prices of oil seeds and vegetable oils slid (−2.6% after −0.1%), because the soybean meal price decreased for the fourth month in a row.
graphiqueG_alim_ang – Food
- Source: INSEE
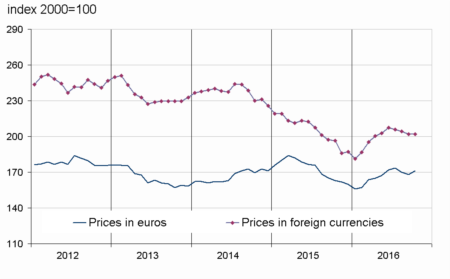
graphiqueG_ensemble_ang – Imported raw materials (excluding energy)
- Source: INSEE
tableautabmatprem – Imported raw materials (excluding energy) in euros
| Index | Changes (%) | |||
|---|---|---|---|---|
| of last month | over the last month | over the last 3 months | over the last 12 months | |
| Food total | 210.0 | –0.1 | –4.8 | –1.2 |
| Tropical foodstuffs | 211.7 | 0.7 | –1.9 | –1.9 |
| Oil seeds, vegetable oils | 228.7 | –2.6 | –7.2 | –2.1 |
| Cereals | 146.0 | 1.8 | –11.1 | –1.1 |
| Sugar | 232.9 | 9.2 | 16.8 | 65.2 |
| Beef meat | 132.9 | –1.0 | –8.4 | –16.8 |
| Industrial raw materials | 158.0 | 3.0 | 0.8 | 9.7 |
| Agricultural raw materials | 117.6 | 3.0 | 0.7 | 9.8 |
| Natural Fibres | 136.5 | 2.7 | –2.1 | 16.2 |
| Natural rubber | 151.9 | 9.1 | 10.9 | 21.7 |
| Hides | 78.6 | 4.0 | 2.6 | 4.4 |
| Wood pulp | 99.6 | 1.6 | 0.1 | –0.7 |
| Tropical wood | 93.5 | –4.4 | –5.8 | –17.9 |
| Sawn softwood | 104.3 | 3.4 | –1.1 | 25.3 |
| Minerals | 180.2 | 3.0 | 0.8 | 9.6 |
| Iron ore | 389.9 | 4.2 | 2.9 | 12.2 |
| Non-ferrous metals | 148.2 | 3.4 | 1.3 | 7.9 |
| Precious metals | 245.8 | –4.7 | –9.1 | 7.6 |
| All commodities | 171.0 | 1.8 | –1.4 | 5.0 |
- Source : INSEE
Pour en savoir plus
Time series : Raw materials prices
