


 28 October 2016
2016- n° 289In August 2016, the sales volume rebounded in trade and repair of motor vehicles and
motorcycles Sales volume in the retail trade and personal services - August 2016
28 October 2016
2016- n° 289In August 2016, the sales volume rebounded in trade and repair of motor vehicles and
motorcycles Sales volume in the retail trade and personal services - August 2016
Every index in this issue (except those on large scale food retailing survey) is in volume (tax excluded), seasonally and working day adjusted (SA-WDA). The commentary shows variations of subsections by decreasing contribution. The contribution of a subsection depends on the extent of the change and on its weight.
In August 2016, the sales volume rebounded sharply in trade and repair of motor vehicles and motorcycles (+3.6%) after two months of decline (−2.4% in July and −0,5% in June). It recovered slightly in retail trade, except of motor vehicles and motorcycles (+0.2% after −0.2%). It accelerated in accommodation and food service activities (+0.8% after +0.3%). On the contrary, the sales volume decreased in household services (−1.3% after +0.8%).
graphiqueGraph1_anglais – Sales volume in the retail trade and personal services
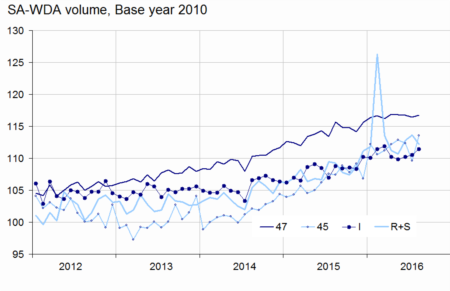
- Source: INSEE
Slight increase in retail trade
In August 2016, the sales volume in retail trade, except of motor vehicles and motorcycles edged up, returning to the June level (+0.2% after −0.2%). According to early estimates, it should increase again in September (+0.5%).
The sales volume picked up strongly in retail trade not in stores (+6,5% après −4,0%). It increased a little in non-specialised stores (+0.2% as in July). It decreased slightly in specialised stores (−0.3% after −0.1%) : declines in retail sale of other goods in
specialised stores (clothing, perfumes, etc.: −0.9%) and in retail sale of information and communication equipment (−2.4%) were not offset by increases in retail sale of automotive fuel (+1.3%) and in retail sale of food, beverages and tobacco (+1.2%).
The sales volume in retail trade, except of motor vehicles and motorcycles was stable over the last three months and increased sharply year-on-year (+1.9% y-o-y).
tableauTab1_anglais – Variation of sales volume in the retail trade and personal services
| Change in % | |||||
|---|---|---|---|---|---|
| NACE Classification | Weight | Aug./ July | July/ June | q-o-q (1) | y-o-y (2) |
| 47 Retail trade, except of motor vehicles and motorcycles | 1000 | 0.2 | –0.2 | 0.0 | 1.9 |
| 471 Retail sale in non-specialized stores | 370 | 0.2 | 0.2 | 1.0 | 0.4 |
| 472 to 477 Retail sale in specialized stores | 572 | –0.3 | –0.1 | –0.4 | 2.6 |
| 478 and 479 Retail trade not in stores | 58 | 6.5 | –4.0 | –2.3 | 3.6 |
| 45 Trade and repair of motor vehicles and motorcycles | 1000 | 3.6 | –2.4 | –0.2 | 4.5 |
| I Accommodation and food service activities | 1000 | 0.8 | 0.3 | 0.1 | 2.5 |
| R+S Household services | 1000 | –1.3 | 0.8 | 0.9 | 4.1 |
| R Arts, entertainment and recreation | 422 | –5.9 | 4.0 | 3.2 | 8.6 |
| S Other service activities | 578 | 2.9 | –2.0 | –0.9 | 0.5 |
- (1) Quarter-on-quarter: last three months /previous three months.
- (2) Year-on-year: last three months / same three months of the previous year.
- The codes correspond to different levels of aggregation of the classification NAF rev.2
- Source: INSEE
tableauTabprecoce_anglais – Sales volume in the retail trade : early estimate*
| Change in % | ||
|---|---|---|
| Sept. 2016/ Aug. 2016 | Sept. 2016/ Sept. 2015 | |
| 47 Retail trade, except of motor vehicles and motorcycles | 0.5 | 2.1 |
- * Econometric estimate from a set of sources available within 30 days after the end of the reference month
- Source: INSEE
Sharp rebound in trade and repair of motor vehicles and motorcycles
The sales volume in trade and repair of motor vehicles and motorcycles recovered sharply in August (+3.6%) after two months of decline (−2.4% in July and −0.5% in June). This overall rebound was particularly strong in sale of motor vehicles (+4.8%) and sale of motor vehicle parts and accessories (+1.6%).
The sales volume of the whole sector decreased slightly over the last three months (−0.2% q-o-q) and grew substantially year-on-year (+4.5% y-o-y).
tableauTab2_anglais – Sales volume in the retail trade and personal services
| Change in % | |||||
|---|---|---|---|---|---|
| Nace Classification | Weight | Aug. 2016 | Aug./ July | July/ June | q-o-q (1) |
| 47 Retail trade, except of motor vehicles and motorcycles | 1000 | 116.7 | 0.2 | –0.2 | 0.0 |
| 471 Non-specialised stores | 370 | 110.8 | 0.2 | 0.2 | 1.0 |
| 472 to 477 Specialised stores | 572 | 119.9 | –0.3 | –0.1 | –0.4 |
| 472 Retail sale of food, beverages and tobacco in specialised stores | 48 | 131.2 | 1.2 | –1.2 | 0.5 |
| 473 Retail sale of automotive fuel | 77 | 95.7 | 1.3 | 5.1 | –5.9 |
| 474 Retail sale of information and communication equipment | 28 | 173.5 | –2.4 | –0.5 | –0.6 |
| 475 Retail sale of other household equipment | 113 | 103.8 | –0.2 | –2.0 | –1.5 |
| 476 Retail sale of cultural and recreation goods | 48 | 107.8 | 0.6 | –0.6 | 2.1 |
| 477 Retail sale of other goods in specialised stores | 259 | 128.5 | –0.9 | –0.2 | 0.7 |
| 478 et 479 Retail trade not in stores | 58 | 122.9 | 6.5 | –4.0 | –2.3 |
| 45 Wholesale and retail trade and repair of motor vehicles and motorcycles | 1000 | 113.6 | 3.6 | –2.4 | –0.2 |
| 451 Sale of motor vehicles | 671 | 110.3 | 4.8 | –3.3 | –0.4 |
| 452 Maintenance and repair of motor vehicles | 78 | 103.8 | 2.0 | –1.8 | –1.0 |
| 453 Sale of motor vehicle parts and accessories | 227 | 129.4 | 1.6 | –0.6 | 0.5 |
| 454 Sale, maintenance and repair of motorcycles and related parts and accessories | 24 | 88.3 | 0.6 | –0.9 | –1.1 |
| I Accommodation and food service activities | 1000 | 111.5 | 0.8 | 0.3 | 0.1 |
| 55 Accommodation | 239 | 103.3 | –1.2 | 1.4 | –1.1 |
| 56 Food and beverage service activities | 761 | 114.0 | 1.4 | 0.0 | 0.4 |
| 561 Restaurants… | 560 | 114.2 | 1.6 | 0.1 | 0.4 |
| 562 Event catering… | 119 | 105.4 | –0.4 | –0.8 | –1.5 |
| 563 Beverage serving activities | 82 | 125.2 | 2.4 | 0.6 | 3.1 |
| R+S Household services | 1000 | 112.2 | –1.3 | 0.8 | 0.9 |
| R Arts, entertainment and recreation | 422 | 119.4 | –5.9 | 4.0 | 3.2 |
| 90 Creative, arts and entertainment activities | 116 | 112.2 | 4.7 | –1.2 | 1.2 |
| 91 Libraries, archives, museums… | 10 | 125.6 | –2.5 | 3.8 | –1.9 |
| 92 Gambling and betting activities | 106 | 113.0 | –3.4 | –4.4 | 2.5 |
| 93 Sports activities and amusement... | 190 | 127.0 | –12.1 | 11.1 | 4.9 |
| S Other service activities | 578 | 106.9 | 2.9 | –2.0 | –0.9 |
| 95 Repair of computers… | 206 | 89.6 | 1.8 | –3.5 | –3.9 |
| 96 Other personal service activities | 372 | 116.5 | 3.4 | –1.3 | 0.4 |
- (1) Quarter-on-quarter: last three months /previous three months.
- Source: INSEE
Further rise in accommodation and food service activities
The sales volume in accommodation and food service activities accelerated in August (+0.8% after +0.3%). This growth was due to food and beverage service activities (+1.4%), mostly to restaurants and fast food activities (+1.6%) and beverage serving activities (+2.4%). However, the sales volume fell back in accommodation (−1.2% after +1.4%).
The sales volume of the whole sector was virtually stable over the last three months (+0.1% q-o-q) and increased sharply year-on-year (+2.5% y-o-y).
Retreat in household services
In August, the sales volume in household services fell back (−1.3% after +0.8%). This decrease affected mainly sports activities and amusement and recreation activities (−12.1%) and to a lesser extent, gambling and betting activities (−3.4%). However, the sales volume recovered in other personal service activities (hairdressing, laundry services, etc .: +3.4%) and in creative, arts and entertainment activities (+4.7%).
The sales volume in household services grew over the last three months (+0.9% q-o-q) and strongly year-on-year (+4.1% y-o-y).
Revisions
The variation in the sales volume for July 2016 has been raised by 0.6 points in accommodation and food services activities, by 0.2 points in trade and repair of motor vehicles and by 0.1 points in retail trade, except of motor vehicles and in household services. These revisions are due, in particular, to adjustments related to lags in VAT returns in July and August and to the new calculation of the SA-WDA coefficients.
In September 2016, turnover recovered in large-scale food retailing
In September 2016, the turnover in large-scale food retailing bounced back (+0.9% after −0.5% in August) thanks to the sales of food products (+1.7%). The sales of non food-products have dwindled since May 2016 (–0.5% on average from May to September). Sales of automotive fuel stalled.
tableauTab3_anglais – Monthly turnover indices in large-scale food retailing
| Change in % | ||||
|---|---|---|---|---|
| Sept. 16/ Aug. 16 | Aug./ July | q-o-q (1) | y-o-y (1) | |
| Turnover | 0.9 | –0.5 | 0.4 | –0.5 |
| Including | ||||
| Sales of food products | 1.7 | –0.1 | 1.7 | 0.5 |
| Sales of non-food products | –0.2 | –0.3 | –1.8 | –2.8 |
| Sales of automotive fuel | 0.0 | –0.9 | –2.9 | –4.6 |
- (1) Quarter-on-quarter: last three months / previous three months.
- Source: INSEE - Monthly survey on large scale food retailing (Emagsa)
Documentation
Methodology (pdf,121 Ko)
Pour en savoir plus
