


 29 July 2016
2016- n° 203In May 2016, the sales volume increased slightly in retail trade but fell again in
personal services Sales volume in the retail trade and personal services - May 2016
29 July 2016
2016- n° 203In May 2016, the sales volume increased slightly in retail trade but fell again in
personal services Sales volume in the retail trade and personal services - May 2016
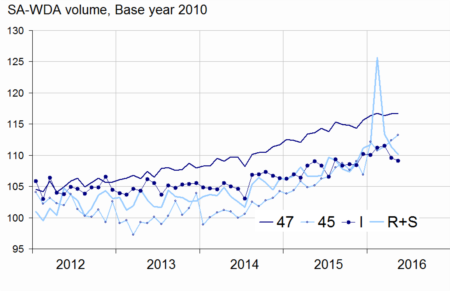
In May 2016, the sales volume increased again in trade and repair of motor vehicles and motorcycles (+0.7% after +0.9% in April) and levelled off virtually in retail trade, except of motor vehicles and motorcycles (+0.1% after +0.3%). On the contrary, it went down again in household services (−1.1 % after −1.8 %) as well as in accommodation and food service activities (−0.4% after −1.8%).

Every index in this issue is in value (tax excluded), seasonally and working day adjusted (SA-WDA). The commentary shows variations of subsections by decreasing contribution. The contribution of a subsection depends on the extent of the change and on its weight.
In May 2016, the sales volume increased again in trade and repair of motor vehicles and motorcycles (+0.7% after +0.9% in April) and levelled off virtually in retail trade, except of motor vehicles and motorcycles (+0.1% after +0.3%). On the contrary, it went down again in household services (−1.1 % after −1.8 %) as well as in accommodation and food service activities (−0.4% after −1.8%).
graphiqueGraph1_anglais – Sales volume in the retail trade and personal services
- Source: Insee
Virtual stability in retail trade
In May 2016, the sales volume stalled in retail trade, except of motor vehicles and motorcycles (+0.1% after +0.3% in April). According to early estimates, it should fold in June 2016 (−0,4%).
While sales volume recovered in non specialised stores (+1.5% after −1.1%), it declined significantly in retail trade not in stores (−5.4% after +6.7%) returning to the level of March. In specialised stores, it declined very slightly (−0.2%) : the sharp fall in retail sale of other household equipment (home appliance, furniture, etc. : −2.7%, after +1.6%) was almost offset by a strong rise in retail sale of automotive fuel (+4.8% after −0,8%).
The sales volume in retail trade, except of motor vehicles and motorcycles increased over the last three months (+0.3%) and year on year (+3.1%).
tableauTab1_anglais – Sales volume in the retail trade and personal services
| Change in % | |||||
|---|---|---|---|---|---|
| NACE Classification | Weight | May/ Apr | Apr/ Mar | q-o-q (1) | y-o-y (2) |
| 47 Retail trade, except of motor vehicles and motorcycles | 1000 | 0.1 | 0.3 | 0.3 | 3.1 |
| 471 Retail sale in non-specialized stores | 370 | 1.5 | –1.1 | –0.1 | 0.6 |
| 472 to 477 Retail sale in specialized stores | 572 | –0.2 | 0.4 | 0.3 | 4.3 |
| 478 and 479 Retail trade not in stores | 58 | –5.4 | 6.7 | 2.2 | 6.3 |
| 45 Trade and repair of motor vehicles and motorcycles | 1000 | 0.7 | 0.9 | 2.2 | 6.7 |
| I Accommodation and food service activities | 1000 | –0.4 | –1.8 | –0.4 | 2.0 |
| R+S Household services | 1000 | –1.1 | –1.8 | –3.9 | 4.2 |
| R Arts, entertainment and recreation | 422 | 0.1 | –0.3 | –7.6 | 8.3 |
| S Other service activities | 578 | –2.1 | –2.9 | –0.7 | 1.2 |
- (1) Quarter-on-quarter: last three months /previous three months.
- (2) Year-on-year: last three months / same three months of the previous year.
- The codes correspond to different levels of aggregation of the classification NAF rev.2
- Source: INSEE
tableauTabprecoce_anglais – Sales volume in the retail trade: early estimate*
| Change in % | ||
|---|---|---|
| June 2016/ May 2016 | June 2016/ June 2015 | |
| 47 Retail trade, except of motor vehicles and motorcycles | –0.4 | 1.7 |
- * Econometric estimate from a set of sources available within 30 days after the end of the reference month
- Source: INSEE
Three-month-in-a-row increase in trade and repair of motor vehicles and motorcycles
In May, the sales volume in retail trade and repair of motor vehicles and motorcycles continued to increase (+0.7% after +0.8% on average since March), including those of sale of motor vehicle parts and accessories (+1.7%) and sale of motor vehicles (+0.3%).
The sales volume of the whole sector grew sharply over the last three months (+2.2%) and year on year (+6.7%).
tableauTab2_anglais – Sales volume in the retail trade and personal services
| Change in % | |||||
|---|---|---|---|---|---|
| Nace Classification | Weight | May 2016 | May/ Apr | Apr/Mar | q-o-q (1) |
| 47 Retail trade. except of motor vehicles and motorcycles | 1000 | 116.7 | 0.1 | 0.3 | 0.3 |
| 471 Non-specialised stores | 370 | 110.0 | 1.5 | –1.1 | –0.1 |
| 472 to 477 Specialised stores | 572 | 120.8 | –0.2 | 0.4 | 0.3 |
| 472 Retail sale of food. beverages and tobacco in specialised stores | 48 | 129.8 | 0.0 | –0.6 | 0.7 |
| 473 Retail sale of automotive fuel | 77 | 102.2 | 4.8 | –0.8 | –0.2 |
| 474 Retail sale of information and communication equipment | 28 | 176.4 | –2.0 | 1.8 | 1.3 |
| 475 Retail sale of other household equipment | 113 | 105.0 | –2.7 | 1.6 | 0.8 |
| 476 Retail sale of cultural and recreation goods | 48 | 103.8 | –2.9 | 2.7 | –0.7 |
| 477 Retail sale of other goods in specialised stores | 259 | 128.6 | 0.3 | –0.1 | 0.2 |
| 478 et 479 Retail trade not in stores | 58 | 119.8 | –5.4 | 6.7 | 2.2 |
| 45 Wholesale and retail trade and repair of motor vehicles and motorcycles | 1000 | 113.2 | 0.7 | 0.9 | 2.2 |
| 451 Sale of motor vehicles | 671 | 109.7 | 0.3 | 1.4 | 2.7 |
| 452 Maintenance and repair of motor vehicles | 78 | 104.5 | 0.7 | –0.7 | 1.3 |
| 453 Sale of motor vehicle parts and accessories | 227 | 129.2 | 1.7 | 0.2 | 1.5 |
| 454 Sale. maintenance and repair of motorcycles and related parts and accessories | 24 | 89.5 | 1.3 | –1.9 | –3.0 |
| I Accommodation and food service activities | 1000 | 109.1 | –0.4 | –1.8 | –0.4 |
| 55 Accommodation | 239 | 104.7 | 2.5 | –4.7 | 1.2 |
| 56 Food and beverage service activities | 761 | 110.5 | –1.2 | –0.9 | –0.8 |
| 561 Restaurants… | 560 | 110.1 | –1.7 | –1.1 | –1.5 |
| 562 Event catering… | 119 | 107.3 | 0.2 | –0.1 | 2.2 |
| 563 Beverage serving activities | 82 | 117.8 | –0.3 | –0.9 | –0.4 |
| R+S Household services | 1000 | 110.2 | –1.1 | –1.8 | –3.9 |
| R Arts. entertainment and recreation | 422 | 118.2 | 0.1 | –0.3 | –7.6 |
| 90 Creative. arts and entertainment activities | 116 | 110.6 | 7.2 | –5.3 | 0.4 |
| 91 Libraries. archives. museums… | 10 | 126.6 | 2.2 | –9.9 | –0.7 |
| 92 Gambling and betting activities | 106 | 114.9 | 1.2 | –0.5 | 0.2 |
| 93 Sports activities and amusement... | 190 | 124.3 | –4.0 | 3.0 | –14.7 |
| S Other service activities | 578 | 104.2 | –2.1 | –2.9 | –0.7 |
| 95 Repair of computers… | 206 | 90.6 | –0.6 | –7.6 | 2.0 |
| 96 Other personal service activities | 372 | 111.8 | –2.8 | –0.7 | –1.9 |
- (1) Quarter-on-quarter: last three months / previous three months.
- Source: INSEE
New fall in accommodation and food service activities
The sales volume in accommodation and food service activities decreased again in May (−0.4% after −1.8%). It declined in food and beverage service activities (−1.2%), mainly in restaurants and fast food activities (−1.7%) but it recovered in accommodation (+2.5% after −4.7%).
The sales volume of the whole sector reduced over the last three months (−0.4%) but advanced year on year (+2.0%).
Further drop in household services
In May, the sales volume in household services decreased again (−1.1% after −1.8% in April). It diminished sharply again in other service activities (−2.1% after −2.9%), above all in other personal service activities: hairdressing, Beauty, etc.: −2.8%). The sales volume was virtually stable in arts, entertainment and recreation: a strong decline in sports activities and amusement (−4.0% after +3.0%) was offset by a significant rebound in creative, arts and entertainment activities (+7.2% after −5.3% in April).
The sales volume in household services decreased strongly over the last three months (−3.9%) and increased year on year (+4.2%).
Revisions
The variation of the sales volume for April 2016 has been raised by 0.4 points in household services, from −2.2% to −1.8% and by 0.1 points in trade and repair of motor vehicles. The change has been lowered by 0.2 points in accommodation and food services activities and was unchanged in retail trade. except of motor vehicles.
In June, turnover went down again in large-scale food retailing
In June 2016. the turnover in large-scale food retailing folded again but less strongly than in May (−0.4% after −1.2% in May). Sales of automotive fuel shrank considerably (−9.3% after +7.8% in May) and those of non-food products continued to decline (−1.1% after −0.8%). On the contrary, sales of food products recovered (+0.9% after −2.7%).
tableauTab3_anglais – Monthly turnover indices in large-scale food retailing
| Change in % | ||||
|---|---|---|---|---|
| June 16/ May 16 | May 16/ April 16r | q-o-q (1) | y-o-y (2) | |
| Turnover | –0.4 | –1.2 | –0.9 | –1.9 |
| Including | ||||
| Sales of food products | 0.9 | –2.7 | –1.1 | –0.6 |
| Sales of non-food products | –1.1 | –0.8 | 0.0 | –1.7 |
| Sales of automotive fuel | –9.3 | 7.8 | 1.2 | –7.8 |
- (1) Quarter-on-quarter: last three months / previous three months.
- (2) Year-on-year: last three months / same three months of the previous year.
- Source: INSEE - Monthly survey on large scale food retailing (Emagsa)
Documentation
Methodology (pdf,121 Ko)
Pour en savoir plus
