


 29 July 2016
2016- n° 204In May 2016, the turnover rebounded dramatically in the manufacturing industry (+5.1%) Turnover in industry and construction - May 2016
29 July 2016
2016- n° 204In May 2016, the turnover rebounded dramatically in the manufacturing industry (+5.1%) Turnover in industry and construction - May 2016
In May 2016, the turnover rocketed sharply in the manufacturing industry (+5.1%) after a decline in April (–1.1%). Exports took off dramatically (+19.2%), owing to high deliveries of transport equipments.

Every index in this issue is in value (tax excluded), seasonally and working day adjusted. The commentary shows variations of subsections by decreasing contribution. The contribution of a subsection depends on the extent of the change and on its weight.
In May 2016, the turnover rocketed sharply in the manufacturing industry (+5.1%) after a decline in April (–1.1%). Exports took off dramatically (+19.2%), owing to high deliveries of transport equipments.
In the industry as a whole, the turnover improved a little less fiercely (+4.1%), because of a slight fall in the mining and quarrying; energy; water supply; waste management sector (–0.3%).
Rise over the last three months (+0.5%)
Over the last three months, the turnover rose in the manufacturing industry (+0.5%), and more vigourously in the industry as a whole (+0.8%). Indeed, it improved substantially in the mining and quarrying, energy, water supply, waste management (+2.2%).
Over this period, the turnover climbed sharply in the manufacture of transport equipment (+8.0%), owing to the manufacture of other transport equipment (+13.5%). On the other hand, it declined sharply in the manufacture of coke and refined petroleum products (−8.8%) and, to a lesser extent, in the manufacture of food products and beverages (–0.9%), in other manufacturing (−0.4%), and in the manufacture of machinery and equipement goods (–0.5%).
Virtual stability compared to the previous year (−0.1%)
In the manufacturing industry, the turnover remained virtually stable over the last three months, compared to the same months of 2015 (−0.1%)
Over this period, the turnover jumped dramatically in the manufacture of transport equipment (+10.3%), but it plummeted in the manufacture of coke and refined petroleum products (−24.6%) because of the fall of producer prices. It declined more moderately in other manufacturing (−0.7%) and in the manufacture of food products and beverages (−0.9%). It levelled off in the manufacture of machinery and equipment goods .
graphiqueIRgraph3 – Turnover in manufacturing industry
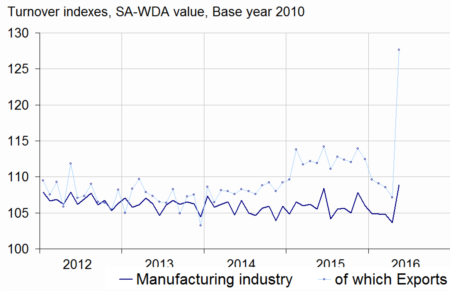
- Source: INSEE
graphiqueIRGraph4 – Turnover in manufacturing industry by sector
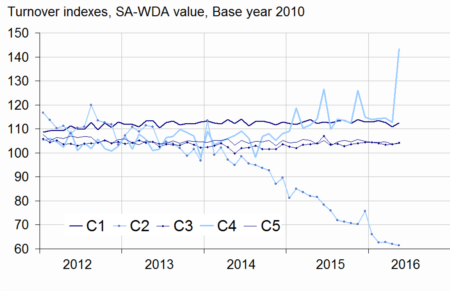
- Source: INSEE
tableauIRtab5 – Variation of the turnover in industry and construction
| Change in % | |||||
|---|---|---|---|---|---|
| NA : A 10, (A 17) | Weight** | May/ Apr. | Apr./ Mar. | q-o-q (1) | y-o-y (2) |
| BE: INDUSTRY | 10000 | 4,1 | –0,4 | 0,8 | –0,2 |
| CZ: MANUFACTURING INDUSTRY | 8346 | 5,1 | –1,1 | 0,5 | –0,1 |
| Of which Exports | 2677 | 19,2 | –1,3 | 3,7 | 2,2 |
| (C1): Manufacture of food products and beverages | 1685 | 1,5 | –1,6 | –0,9 | –0,9 |
| (C2): Manufacture of coke and refined petroleum products | 561 | –0,9 | –1,3 | –8,8 | –24,6 |
| (C3): Machinery and equipment godds | 953 | 0,6 | 0,1 | –0,5 | 0,0 |
| (C4): Manufacture of transport equipment | 1265 | 27,1 | –1,5 | 8,0 | 10,3 |
| (C5): Other manufacturing | 3881 | 0,5 | –1,0 | –0,4 | –0,7 |
| DE: Mining and quarrying; energy; water supply; waste management | 1654 | –0,3 | 2,5 | 2,2 | –0,7 |
| FZ: CONSTRUCTION | 10000 | 2,0 | –0,2 | –0,1 | 0,3 |
- ** 10000=B...E and F
- (1) Quarter-on-quarter: last three months / previous three months
- (2) Year-on-year : last three months / same three months of previous year
- The codes correspond to different levels of aggregation of the NACE classification.
- Source: INSEE
Exceptional bound in transport equipments (+27.1%)
The turnover in the manufacture of transport equipment reached a very high level in May (+27.1%, after −1.5% in April) thanks to the delivery of a very big boat (the luxurious “Harmony of the Seas”) in the manufacture of other transport equipment (+50.9%). The turnover also climbed in the manufacture of motor vehicles (+2.4%).
Rebound in food products and beverages (+1.5%)
The turnover bounced back in the manufacture of food products and beverages in May (+1.5%, after –1.6%).
Slight rebound in “other manufacturing” (+0.5%)
The turnover in “other manufacturing” recovered in May (+0.5%, after −1.0% in April). It grew mainly in the other manufacturing: repair and installation (+1.0%), the manufacture of rubber, plastics and non-metallic mineral products (+1.0%), the manufacture of textiles, wearing apparel... (+2.2%) and the manufacture of basic pharmaceutical products and pharmaceutical preparations (+1.2%). Conversely, it declined once again in the manufacture of chemicals and chemical products (−0.6%).
Rise in machinery and equipment goods (+0.6%)
The turnover in the manufacture of machinery and equipment goods went up in May (+0.6%) after a virtual stability in April (+0.1%). It rebounded in the manufacture of computer, electronic and optical products (+3.0%, after –0.9% in April). On the other hand, it fell back in the manufacture of machinery and equipment n.e.c. (–0.9%, after +1.0%). It remained virtually stable in the manufacture of electrical equipment (+0.1%).
New fall in coke and refined petroleum products (–0.9%)
In May, the turnover fell again in the manufacture of coke and refined petroleum products (–0.9% after –1.3%).
Revisions: +0.1 points in April in the manufacturing industry
In the manufacturing industry, the variation of the turnover in April 2016 has been revised upwards by 0.1 points, at –1.1% instead of –1.2% published previously.
tableauIRtab8 – Indexes of turnover in industry and construction
| Change in % | |||||
|---|---|---|---|---|---|
| Industries: | Weight* | May 2016 | May/ Apr. | Apr./ Mar. | q-o-q (1) |
| BE: INDUSTRY | 10000 | 109,9 | 4,1 | –0,4 | 0,8 |
| CZ: MANUFACTURING INDUSTRY | 8346 | 108,9 | 5,1 | –1,1 | 0,5 |
| of which Exports | 2677 | 127,6 | 19,2 | –1,3 | 3,7 |
| (C1): Man. of food products and beverages | 1685 | 112,5 | 1,5 | –1,6 | –0,9 |
| of which Exports | 285 | 113,9 | 1,9 | –2,3 | –2,0 |
| (C2): Man. of coke and refined petroleum products | 561 | 61,5 | –0,9 | –1,3 | –8,8 |
| (C3): Machinery and equipment goods | 953 | 104,2 | 0,6 | 0,1 | –0,5 |
| of which Exports | 469 | 101,1 | 0,2 | 0,1 | –1,8 |
| [CI] Man. of computer, electronic and optical products | 306 | 104,4 | 3,0 | –0,9 | 1,4 |
| [CJ] Man. of electrical equipment | 245 | 97,5 | 0,1 | –0,1 | –0,3 |
| [CK] Man. of machinery and equipment n.e.c. | 402 | 108,0 | –0,9 | 1,0 | –2,0 |
| (C4): Man. of transport equipment | 1265 | 143,4 | 27,1 | –1,5 | 8,0 |
| of which Exports | 617 | 206,6 | 76,7 | –4,3 | 21,1 |
| [CL1] Man. of motor vehicles, trailers and semi-trailers | 702 | 102,0 | 2,4 | 0,5 | 2,0 |
| [CL2] Man. of other transport equipment | 562 | 195,1 | 50,9 | –3,3 | 13,5 |
| (C5): Other manufacturing | 3881 | 104,1 | 0,5 | –1,0 | –0,4 |
| of which Exports | 1237 | 105,2 | –0,8 | 0,1 | –2,0 |
| [CB] Man. of textiles, wearing apparel, leather and related products | 188 | 110,6 | 2,2 | –0,3 | 0,4 |
| [CC] Man. of wood and paper products; printing and reproduction of recorded media | 436 | 96,7 | 0,7 | –0,7 | –0,9 |
| [CE] Man. of chemicals and chemical products | 745 | 98,0 | –0,6 | –0,7 | –2,6 |
| [CF] Man. of basic pharmaceutical products and pharmaceutical preparations | 304 | 111,3 | 1,2 | 1,5 | 0,3 |
| [CG] Man. of rubber and plastics products, and other non-metallic mineral products | 629 | 103,3 | 1,0 | 0,1 | 0,1 |
| [CH] Man. of basic metals and fabricated metal products, except machinery and equipment | 926 | 99,4 | –0,2 | –3,5 | 0,0 |
| [CM] Other manufacturing; repair and installation of machinery and equipment | 653 | 117,9 | 1,0 | –0,3 | 0,6 |
| DE: Mining and quarrying; energy, water supply, sewerage, waste management | 1654 | 114,9 | –0,3 | 2,5 | 2,2 |
| [BZ] Mining and quarrying | 70 | 86,5 | –3,8 | –0,3 | –4,5 |
| [DZ] Electricity, gas, steam and air-conditioning supply | 1205 | 116,8 | –1,5 | 3,9 | 2,8 |
| [EZ] Water supply; sewerage, waste management and remediation | 379 | 114,0 | 4,4 | –1,6 | 1,3 |
| FZ: CONSTRUCTION | 10000 | 104,5 | 2,0 | –0,2 | –0,1 |
- ** 10000=B...E and F
- (1) Quarter-on-quarter: last three months / previous three months
- Source: INSEE
tableauIRtab7 – Measure of variations' revisions
| Apr./ Mar.. | Mar./ Feb.. | Feb./ Jan.. | Q2 2016/ Q1 2016 | 2015/ 2014 | |
|---|---|---|---|---|---|
| Industry (BE) | 0,21 | 0,10 | –0,13 | –0,14 | 0,00 |
| raw seriee | 0,05 | 0,05 | –0,01 | –0,14 | 0,00 |
| SA-WDA coeff.. | 0,16 | 0,05 | –0,12 | 0,00 | 0,00 |
| Manufacturing industry (CZ) | 0,08 | 0,07 | –0,12 | –0,17 | 0,00 |
| raw seriee | 0,05 | 0,05 | –0,02 | –0,15 | 0,00 |
| SA-WDA coeff.. | 0,03 | 0,02 | –0,10 | –0,01 | 0,00 |
- How to read it: in the manufacturing industry, the SA-WDA evolution between March and April 2016 is revised by +0.08 points: +0.05 points are due to the raw serie's revision and +0.03 points to the new calculation of the SA-WDA.
- Source: INSEE
Documentation
Methodology (pdf,140 Ko)
Pour en savoir plus
Time series : Turnover indices (VAT)
