


 16 September 2016
2016- n° 239In Q2 2016, the labour cost index - wages and salaries increased by 0.3% and the labour
cost index - total labour cost decreased by 0.2% Labor cost index in industry, construction and services - 2nd Quarter 2016
16 September 2016
2016- n° 239In Q2 2016, the labour cost index - wages and salaries increased by 0.3% and the labour
cost index - total labour cost decreased by 0.2% Labor cost index in industry, construction and services - 2nd Quarter 2016
In the second quarter of 2016, the labour cost index (LCI) - wages and salaries in the non-agricultural market sector increased (+0.3%) slightly slower than in the previous quarter (+0.5% quarter-on-quarter, in seasonally adjusted data). Year-on-year, it rose by +1.5% as in Q1 2016. The average working time was stable after +0.1% y-o-y in the first quarter.
- The labour cost index - wages and salaries increased by 0.3%
- Wages rose almost at the same pace in industrial activities
- Over the quarter, wages decelerated slightly in services and falthered in constuction
- Slight downward revision for the Q1 2016
- The labour cost index - total labour cost decreased by 0.2%
- Downward revision of LCI – total labour cost for Q1 2016

Warnings:
- Since 1st April 2016, the eligibility threshold for the reduced employer's contribution rate for family allowance has been raised to wages below 3.5 minimum wages after a threshold at wages below 1.6 mimium wages since January 2015. The effect of the raising of the threshold is estimated at −5 points on average on the whole LCI – total labour cost for Q2 2016.
- Since 1st January 2016, the rate of the tax credit for encouraging competitiveness and jobs (CICE) has increased from 7.5% to 9.0% in overseas departments only.
The labour cost index - wages and salaries increased by 0.3%
In the second quarter of 2016, the labour cost index (LCI) - wages and salaries in the non-agricultural market sector increased (+0.3%) slightly slower than in the previous quarter (+0.5% quarter-on-quarter, in seasonally adjusted data). Year-on-year, it rose by +1.5% as in Q1 2016. The average working time was stable after +0.1% y-o-y in the first quarter.
graphiqueGraphSSangl – LCI - wages and salaries: year-on-year changes
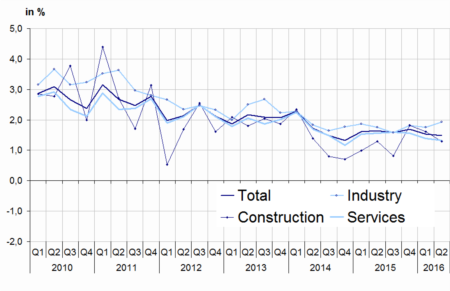
- Scope: non-agricultural market sector excluding household services
- Sources: ACOSS, DARES, INSEE
Wages rose almost at the same pace in industrial activities
In Q2 2016, wages in industrial activities rose at almost the same pace than in the previous quarter (+0.5% q-o-q after +0.4% in Q1 2016). Year-on-year, they accelerated slightly (+1.9% after 1.7% in the first quarter).
Over the quarter, wages decelerated slightly in services and falthered in constuction
In services, wages slowed in Q2 2016 (+0.3% q-o-q after +0.5% in Q1). Nevertheless, year-on-year, wages rose at about the same pace than in the previous quarter (+1.3% after +1.4%).
In construction, wages faltered: −0.1% q-o-q after +0.4% in Q1 2016. Year-on-year, wages continued to rise, but slowed down (+1.3% after +1.6%).
tableautableauSSangl – LCI - wages and salaries
| Quarterly variations (%) | Annual variations (%) | |||
|---|---|---|---|---|
| T1-16 | T2-16 | T1-16 | T2-16 | |
| Industry | 0.4 | 0.5 | 1.7 | 1.9 |
| Mining and quarrying | –0.1 | 0.3 | 0.4 | –4.3 |
| Manufacturing | 0.5 | 0.4 | 1.8 | 1.9 |
| Electricity, gas, steam and air conditioning supply | 0.7 | 2.1 | 1.7 | 3.1 |
| Water supply; sewerage, waste management and remediation activities | 0.0 | 0.6 | 0.7 | 1.3 |
| Services | 0.5 | 0.3 | 1.4 | 1.3 |
| Wholesale and retail trade; repair of motor vehicles and motorcycles | 0.3 | 0.3 | 1.5 | 1.3 |
| Transportation and storage | 0.3 | 0.6 | 1.2 | 1.0 |
| Accommodation and food service activities | 0.7 | –0.8 | 1.5 | –0.2 |
| Information and communication | 0.7 | 0.5 | 1.4 | 1.9 |
| Financial and insurance activities | 0.5 | 0.5 | 3.2 | 2.9 |
| Real estate activities | 0.8 | 0.5 | 3.9 | 3.0 |
| Professional, scientific and technical activities | 1.1 | 0.5 | 1.8 | 2.7 |
| Administrative and support service activities | 0.1 | 0.3 | 0.1 | 0.0 |
| Construction | 0.4 | –0.1 | 1.6 | 1.3 |
| TOTAL | 0.5 | 0.3 | 1.5 | 1.5 |
- Scope: non-agricultural market sector excluding household services Sources: ACOSS, DARES, INSEE
Slight downward revision for the Q1 2016
The variation in LCI - wages and salaries in the first quarter of 2016 in the non-agricultural market sector excluding household services has been revised downwards by 0.1 points, q-o-q as well as y-o-y.
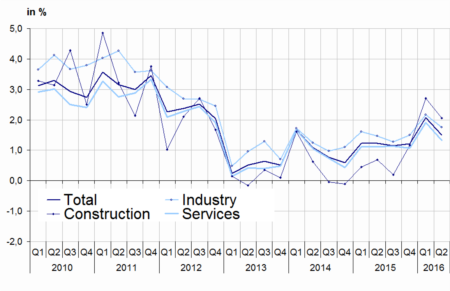
The labour cost index - total labour cost decreased by 0.2%
In the second quarter of 2016, the labour cost index (LCI) - total labour cost in the non-agricultural market sector decreased quarter-on-quarter (−0.2% in seasonally adjusted data, after +1.0% in Q1 2016). This downturn is mainly due to the extension, since 1st April 2016, of the eligibility threshold for the reduced employer's contribution rate for family allowance to wages between 1.6 and 3.5 minimum wages. The impact of this measure on the whole LCI – total labour cost index has been estimated at −0.5 points for Q2 2016.
Year-on-year, the LCI - total labour cost also decelerated strongly (+1.5% after +2.1%) for the same reason. Without the tax credit for encouraging competitiveness and jobs (CICE), the growth would have been the same.
graphiqueGraphSCangl – LCI - total labor cost: year-on-year changes
Downward revision of LCI – total labour cost for Q1 2016
The variation in LCI – total labour cost in the first quarter of 2016, in the non-agricultural market sector excluding household services has been revised downwards by 0.2 percentage points, quarter-on-quarter. The variation is unchanged year-on-year.
tableautableauSCangl – LCI - total labor cost
| Quarterly variations (%) | Annual variations (%) | |||
|---|---|---|---|---|
| T1-16 | T2-16 | T1-16 | T2-16 | |
| Industry | 0.8 | –0.1 | 2.2 | 1.8 |
| Mining and quarrying | 0.4 | –0.1 | 1.0 | –4.3 |
| Manufacturing | 0.9 | –0.2 | 2.3 | 1.7 |
| Electricity, gas, steam and air conditioning supply | 0.9 | 1.6 | 2.0 | 2.9 |
| Water supply; sewerage, waste management and remediation act | 0.3 | 0.0 | 0.9 | 0.9 |
| Services | 1.0 | –0.3 | 1.9 | 1.3 |
| Wholesale and retail trade; repair of motor vehicles and motorcycles | 1.0 | –0.3 | 2.3 | 1.6 |
| Transportation and storage | 0.6 | 0.2 | 1.4 | 0.9 |
| Accommodation and food service activities | 1.3 | –1.3 | 2.1 | –0.1 |
| Information and communication | 1.0 | –0.1 | 1.8 | 1.7 |
| Financial and insurance activities | 0.8 | –0.1 | 3.4 | 2.6 |
| Real estate activities | 1.2 | 0.0 | 4.6 | 3.1 |
| Professional, scientific and technical activities | 1.5 | –0.2 | 2.3 | 2.5 |
| Administrative and support service activities | 1.3 | –0.3 | 0.9 | 0.4 |
| Construction | 1.4 | –0.5 | 2.7 | 2.1 |
| TOTAL | 1.0 | –0.2 | 2.1 | 1.5 |
- Scope: non-agricultural market sector excluding household services
- Sources: ACOSS, DARES, INSEE
tableautableauhCICEangl – LCI - total labor cost (without CICE)
| Quarterly variations (%) | Annual variations (%) | |||
|---|---|---|---|---|
| T1-16 | T2-16 | T1-16 | T2-16 | |
| Industry | 0.8 | –0.1 | 2.2 | 1.8 |
| Mining and quarrying | 0.8 | –0.1 | 1.4 | –3.9 |
| Manufacturing | 0.9 | –0.2 | 2.3 | 1.8 |
| Electricity, gas, steam and air conditioning supply | 0.9 | 1.6 | 2.0 | 2.9 |
| Water supply; sewerage, waste management and remediation act | 0.3 | 0.0 | 0.9 | 0.9 |
| Services | 1.0 | –0.3 | 1.9 | 1.3 |
| Wholesale and retail trade; repair of motor vehicles and motorcycles | 1.0 | –0.3 | 2.3 | 1.6 |
| Transportation and storage | 0.6 | 0.2 | 1.4 | 0.9 |
| Accommodation and food service activities | 1.3 | –1.3 | 2.1 | –0.1 |
| Information and communication | 1.0 | –0.1 | 1.8 | 1.7 |
| Financial and insurance activities | 0.8 | –0.1 | 3.4 | 2.6 |
| Real estate activities | 1.3 | 0.0 | 4.6 | 3.1 |
| Professional, scientific and technical activities | 1.5 | –0.2 | 2.3 | 2.5 |
| Administrative and support service activities | 1.2 | –0.3 | 0.9 | 0.4 |
| Construction | 1.4 | –0.5 | 2.7 | 2.0 |
| TOTAL | 1.0 | –0.2 | 2.1 | 1.5 |
- Scope: non-agricultural market sector excluding household services
- Sources: ACOSS, DARES, INSEE
Documentation
Methodological Note (pdf,132 Ko)
Estimate of effects of new 2016 measures (pdf,164 Ko)
Supplementary Methodological Note SA-WDA (pdf,257 Ko)
Pour en savoir plus
