


 16 June 2016
2016- n° 154Further rise in business start-ups in May 2016 Enterprise births - May 2016
16 June 2016
2016- n° 154Further rise in business start-ups in May 2016 Enterprise births - May 2016
In May 2016, the number of business births rose by 2.3% for the second month in a row, for all entreprises, seasonally and working-day adjusted. This increase was due to both sole proprietorships excluding self-managed micro-entrepreneurs (+3.4%) and, to a lesser extent, micro-entrepreneurs' registrations (+0.8%).
In May 2016, the number of business births rose by 2.3% for the second month in a row, for all entreprises, seasonally and working-day adjusted. This increase was due to both sole proprietorships excluding self-managed micro-entrepreneurs (+3.4%) and, to a lesser extent, micro-entrepreneurs' registrations (+0.8%).
graphiqueGraph1EN – Business start-ups (sa-wda *)
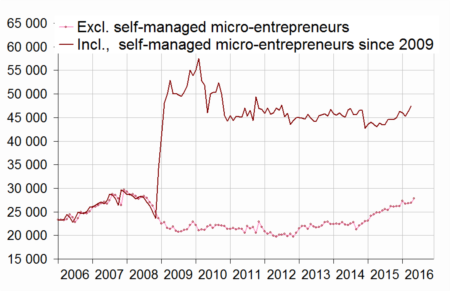
- * Seasonally and working-day adjusted data
- Source: INSEE (Sirene)
tableautab1EN – Business set-ups by month (sa-wda *)
| Feb. 2016 | March 2016 | April 2016 | May 2016 | |
|---|---|---|---|---|
| Excl. self-managed micro-entrepreneurs | 26,663 | 26,799 | 26,935 | 27,864 |
| Variation [m-o-m] % | -2.4 | 0.5 | 0.5 | 3.4 |
| Incl. self-managed micro-entrepreneurs | 45,998 | 45,290 | 46,316 | 47,403 |
| Variation [m-o-m] % | -0.7 | -1.5 | 2.3 | 2.3 |
- * Seasonally and working-day adjusted data
- Source: INSEE (Sirene)
+11.1% year-on-year (quarterly basis)
The raw amount of births added up in the last three months jumped compared to the same period one year before (+11.1%). Every type of business set-ups increased : companies (+15.8%) and sole proprietorship start-ups excluding self-managed micro-entrepreneurs (+13.2%) as well as micro-entrepreneur's registrations (+6.3%). The upturn concerns every economic activity, business support activities and transportation being the sectors that most contributed to the overall rise.1
tableautab2EN – Business start-ups by type
| Moving total % change * | Moving total | Moving total | ||
|---|---|---|---|---|
| over 3 months | over 12 months | January- May 2016 | January- May 2015 | |
| Total | 11.1 | 2.0 | 244,842 | 225,177 |
| Companies | 15.8 | 10.8 | 82,998 | 72,018 |
| Sole proprietorships | 8.9 | -0.2 | 161,844 | 153,159 |
| Of which excluding self-managed micro-entrepreneurs | 13.2 | 2.4 | 62,650 | 55,433 |
| Of which self-managed micro-entrepreneurs | 0.6 | -1.3 | 99,194 | 97,726 |
- * Total of business start-ups during the last 3 or 12 months compared with the same months a year earlier
- Source: INSEE (Sirene)
+2.0% year-on-year (twelve months basis)
The raw number of business start-ups totted up during the last twelve months picked up (+2.0% year-on-year following −1.4% during the previous twelve months). This growth was due to sole proprietorships creations excluding self-managed micro-entrepreneurs (+24.3%) and companies' start-ups (+10.8%). Conversely, self-managed micro-entrepreneurs' set-ups dropped sharply (−13.1%).
Two business set-ups out of five are self-managed micro-entrepreneur's registrations
In May 2016, micro–entrepreneurs' registrations amounted to 41.3% of business set-ups over the twelve last months, as in April. One year before, the share was 48.5%.
tableautab0EN – Business set-ups distribution by type
| March 2016 | April 2016 | May 2016 | |
|---|---|---|---|
| Companies | 33.2 | 33.4 | 33.6 |
| Sole proprietorships excluding self-managed micro-entrepreneurs | 25.1 | 25.1 | 25.1 |
| Self-managed micro-entrepreneurs | 41.5 | 41.3 | 41.3 |
- Source: INSEE (Sirene)

1 The contribution of a sector to the overall variation is the observed variation of this sector, weighted by the share of this sector in the total number of births.
Revisions
The variation of the overall number of business births in April 2016 has been raised by 0.5 points due to the update of the SA parameters and the revision of raw data.
Business set-ups by economic activity
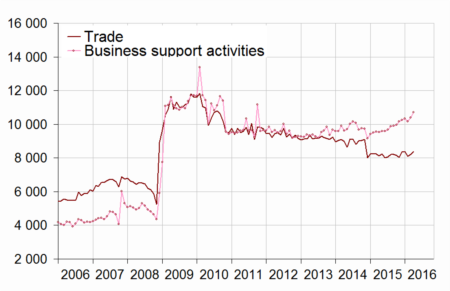
graphiqueGraph2EN – Trade and business support activities start-ups (sa-wda *)
graphiqueGraph3EN – Construction and real estate business set-ups (sa-wda *)
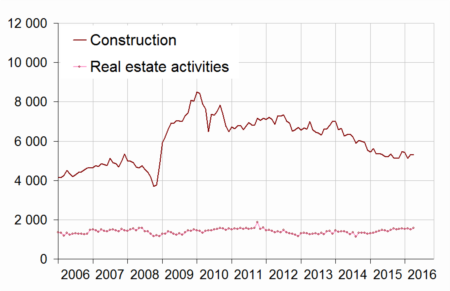
- * Seasonally and working-day adjusted data
- Source : Insee, Sirene
tableautab3EN – Number of business set-ups (incl. self-managed micro-enterprises)
| NA | March 2016 | April 2016 | May 2016 | |
|---|---|---|---|---|
| Total | 45,290 | 46,316 | 47,403 | |
| Industry | BE | 2,086 | 2,050 | 2,104 |
| Of which Manufacturing | C | 1,833 | 1,817 | 1,859 |
| Construction | FZ | 5,134 | 5,328 | 5,297 |
| Wholesale and retail trade, Transport, Accommodation and Food and beverage activities | GI | 12,929 | 13,362 | 13,899 |
| Of which Trade | G | 8,091 | 8,220 | 8,372 |
| Of which Transportation and storage | H | 2,644 | 2,796 | 3,146 |
| Of which Accommodation and food service activities | I | 2,520 | 2,507 | 2,669 |
| Information and communication | JZ | 2,266 | 2,329 | 2,368 |
| Financial and insurance activities | KZ | 1,362 | 1,352 | 1,335 |
| Real estate activities | LZ | 1,558 | 1,513 | 1,573 |
| Business support activities | MN | 10,157 | 10,392 | 10,704 |
| Public administration and defence, education, human health and social work activities | OQ | 5,584 | 5,823 | 5,882 |
| Other services activities | RS | 4,215 | 4,167 | 4,242 |
- * Seasonally and working-day adjusted data
- Source: INSEE (Sirene)
tableautab3bisEN – Fluctuation in the number of business set-ups (incl. self-managed micro-entrepreneurs)
| NA | May 16 / April 16 | Moving total % change** | ||
|---|---|---|---|---|
| sa-wda * | over 3 months | over 12 months | ||
| Total | 2.3 | 11.1 | 2.0 | |
| Industry | BE | 2.6 | 7.9 | -7.7 |
| Of which Manufacturing | C | 2.3 | 9.8 | -8.9 |
| Construction | FZ | -0.6 | 0.5 | -8.2 |
| Wholesale and retail trade, Transport, Accommodation and Food and beverage activities | GI | 4.0 | 14.1 | 5.3 |
| Of which Trade | G | 1.8 | 3.8 | -3.4 |
| Of which Transportation and storage | H | 12.5 | 67.2 | 64.1 |
| Of which Accommodation and food service activities | I | 6.4 | 14.2 | 2.1 |
| Information and communication | JZ | 1.7 | 13.5 | 1.5 |
| Financial and insurance activities | KZ | -1.3 | 5.9 | 6.3 |
| Real estate activities | LZ | 3.9 | 18.6 | 17.8 |
| Business support activities | MN | 3.0 | 15.3 | 5.2 |
| Public administration and defence, education, human health and social work activities | OQ | 1.0 | 11.9 | 3.7 |
| Other services activities | RS | 1.8 | 6.0 | -4.1 |
- Source: INSEE (Sirene)
Pour en savoir plus
Time series : Business demography
