


 12 February 2016
2016- n° 36Rise in business start-ups in January 2016 Enterprise births - January 2016
12 February 2016
2016- n° 36Rise in business start-ups in January 2016 Enterprise births - January 2016
In January 2016, the number of business births kept growing (+3.1% following +1.4% in December for all entreprises, seasonally and working-day adjusted). This rise was a result of the significant upturn in start-ups excluding self-managed micro-entrepreneurs (+4.8%).
In January 2016, the number of business births kept growing (+3.1% following +1.4% in December for all entreprises, seasonally and working-day adjusted). This rise was a result of the significant upturn in start-ups excluding self-managed micro-entrepreneurs (+4.8%).
+0.7% year-on-year (quarterly basis)
The raw amount of births added up in the last three months edged up by 0.7% compared to the same months one year before. Sole proprietorships creations excluding self-managed micro-entrepreneurs shoot up (+26.4%). Transportation and trade were the sectors that most contributed to the overall rise1.
−3.2% year-on-year (twelve months basis)
The raw number of business start-ups totted up during the last twelve months came down by 3.2% year-on-year. This was the result of the sharp drop of self-managed micro-entrepreneurs' set-ups (–20.0%). Conversely, sole proprietorships creations excluding self-managed micro-entrepreneurs soared (+28.6%) and companies' start-ups also improved (+5.4%).
Two business set-ups out of five are self-managed micro-entrepreneur's registrations
In January 2016, micro–entrepreneurs' registrations amounted to 42.6% of business set-ups over the twelve last months. One year before, the share was 51,0%.
tableautab0EN – Business start-ups distribution by type
| Nov. 2015 | Dec. 2015 | Jan. 2016 | |
|---|---|---|---|
| Companies | 32.5 | 32.8 | 33.0 |
| Sole proprietorships excluding self-managed micro-entrepreneurs | 24.2 | 24.7 | 24.9 |
| Self-managed micro-entrepreneurs | 43.3 | 42.6 | 42.1 |
- Source: INSEE (Sirene)

1 The contribution of a sector to the overall variation is the observed variation of this sector, weighted by the share of this sector in the total number of births.
graphiqueGraph1EN – Business start-ups (sa-wda *)
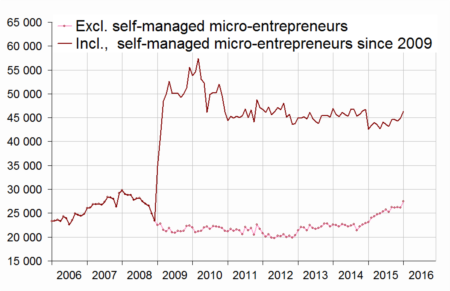
- * Seasonally and working-day adjusted data
- Source: INSEE (Sirene)
graphiqueGraph2EN – Trade and business support activities start-ups (sa-wda *)
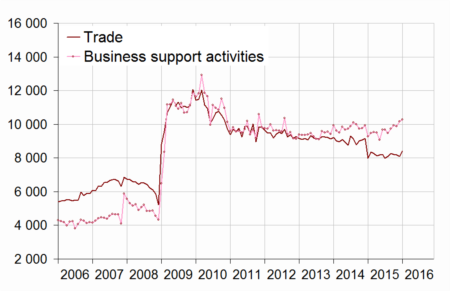
- * Seasonally and working-day adjusted data
- Source : Insee, Sirene
graphiqueGraph3EN – Construction and real estate business start-ups (sa-wda *)
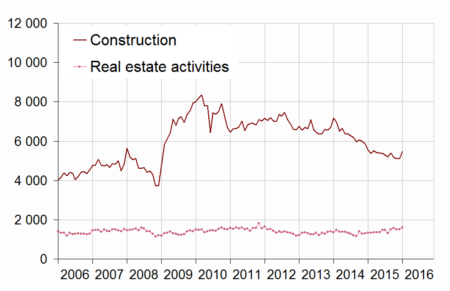
- * Seasonally and working-day adjusted data
- Source : Insee, Sirene
tableautab1EN – Business start-ups by month (sa-wda *)
| Oct. 2015 | Nov. 2015 | Dec. 2015 | Jan. 2016 | |
|---|---|---|---|---|
| Excl. self-managed micro-entrepreneurs | 26,123 | 26,229 | 26,182 | 27,442 |
| Variation [m-o-m] % | −0.4 | 0.4 | −0.2 | 4.8 |
| Incl. self-managed micro-entrepreneurs | 44,580 | 44,333 | 44,942 | 46,356 |
| Variation [m-o-m] % | −0.1 | −0.6 | 1.4 | 3.1 |
- * Seasonally and working-day adjusted data
- Source: INSEE (Sirene)
tableautab2EN – Business start-ups by type
| Moving total % change * | Moving total | Moving total | ||
|---|---|---|---|---|
| over 3 months | over 12 months | in January 2016 | in January 2015 | |
| Total | 0.7 | −3.2 | 48,384 | 46,262 |
| Companies | 10.2 | 5.4 | 15,902 | 14,036 |
| Sole proprietorships | −3.7 | −6.9 | 32,482 | 32,226 |
| Of which self-managed micro-entrepreneurs | −16.2 | −20.0 | 19,681 | 21,034 |
- * Total of business start-ups during the last 3 or 12 months compared with the same months a year earlier
- Source: INSEE (Sirene)
tableautab3EN – Number of business start-ups (incl. self-managed micro-enterprises)
| NA | Nov. 2015 | Dec. 2015 | Jan. 2016 | |
|---|---|---|---|---|
| Total | 44,333 | 44,942 | 46,356 | |
| Industry | BE | 2,029 | 2,003 | 2,077 |
| Of which Manufacturing | C | 1,767 | 1,751 | 1,816 |
| Construction | FZ | 5,113 | 5,099 | 5,466 |
| Wholesale and retail trade, Transport, Accommodation and Food and beverage activities | GI | 12,906 | 13,236 | 13,322 |
| Of which Trade | G | 8,171 | 8,100 | 8,397 |
| Of which Transportation and storage | H | 2,491 | 2,520 | 2,383 |
| Of which Accommodation and food service activities | I | 2,443 | 2,391 | 2,494 |
| Information and communication | JZ | 2,145 | 2,170 | 2,266 |
| Financial and insurance activities | KZ | 1,292 | 1,159 | 1,270 |
| Real estate activities | LZ | 1,512 | 1,504 | 1,591 |
| Business support activities | MN | 9,872 | 10,153 | 10,275 |
| Public administration and defence, education, human health and social work activities | OQ | 5,474 | 5,513 | 5,775 |
| Other services activities | RS | 3,990 | 4,105 | 4,314 |
- * Seasonally and working-day adjusted data
- Source: INSEE (Sirene)
tableautab3bisEN – Fluctuation in the number of business start-ups (incl. self-managed micro-entrepreneurs)
| NA | Jan. 16 / Dec. 15 | Moving total % change** | ||
|---|---|---|---|---|
| sa-wda * | over 3 months | over 12 months | ||
| Total | 3.1 | 0.7 | -3.2 | |
| Industry | BE | 3.7 | −9.3 | −13.7 |
| Of which Manufacturing | C | 3.7 | −11.3 | −16.1 |
| Construction | FZ | 7.2 | −10.0 | −14.9 |
| Wholesale and retail trade, Transport, Accommodation and Food and beverage activities | GI | 0.6 | 4.6 | −0.7 |
| Of which Trade | G | 3.7 | −4.0 | −7.7 |
| Of which Transportation and storage | H | −5.4 | 56.4 | 54.8 |
| Of which Accommodation and food service activities | I | 4.3 | −0.8 | −3.5 |
| Information and communication | JZ | 4.4 | −1.2 | −2.9 |
| Financial and insurance activities | KZ | 9.5 | 3.2 | 9.4 |
| Real estate activities | LZ | 5.8 | 18.0 | 9.2 |
| Business support activities | MN | 1.2 | 5.2 | −0.3 |
| Public administration and defence, education, human health and social work activities | OQ | 4.7 | 0.3 | 2.1 |
| Other services activities | RS | 5.1 | −6.6 | −7.9 |
- * Seasonally and working-day adjusted data
- ** Total of business start-ups during the last 3 or 12 months compared with the same months a year earlier
- Source: INSEE (Sirene)
Pour en savoir plus
Time series : Business demography
