


 29 April 2016
2016- n° 117In February 2016, the turnover levelled off in the manufacturing industry Turnover in industry and construction - February 2016
29 April 2016
2016- n° 117In February 2016, the turnover levelled off in the manufacturing industry Turnover in industry and construction - February 2016
In February 2016, the turnover levelled off in the manufacturing industry after two months in a row of decline (-0.5% in January and -1.9% in December).

Warning: Since the publication of the indexes of January, 2016 on March 31st, the turnover index series are produced according to a new process that improves their quality. The series have been recalculated over the period 1999-2015. Further information concerning these changes is available on the Web page of this index on the Web page of this index.
In February 2016, the turnover levelled off in the manufacturing industry after two months in a row of decline (−0.5% in January and −1.9% in December).
On the contrary, the turnover took off in the industry as a whole (+0.7%, after −0.7% in January) owed to a rebound in the mining and quarrying; energy; water supply; waste management (+3.7%, after −1.8%).
Fall over the last three months (–0.7%)
Over the last three months, the turnover went down in the manufacturing industry (−0.7%) as well as in the industry as a whole (−1.0%). It dropped in the manufacture of transport equipment (−1.8%), in the manufacture of coke and refined petroleum products (−4.6%) and, more moderately, in other manufacturing (−0.4%). Conversely, it rose in the electrical and electronic equipment and machine equipment (+0.6%). It remained stable in the manufacture of food products and beverages.
Slight fall over the last year (−0.3%)
In the manufacturing industry as well as in the industry as a whole, the turnover declined slightly over the last three months, compared to the same three months of the previous year (−0.3%, y-o-y).
Over this period, the turnover plummeted in the manufacture of coke and refined petroleum products (−20.2%) owed to a fall in producer prices. On the contrary, it went up in the manufacture of transport equipment (+2.6%), in the electrical and electronic equipment and machine equipment (+1.0%), in the manufacture of food products and beverages (+0.8%). It also grew, but more slightly, in other manufacturing (+0.2%).
graphiqueIRgraph3 – Turnover in manufacturing industry
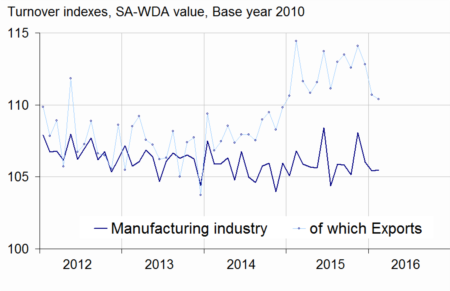
- Source: INSEE
graphiqueIRGraph4 – Turnover in manufacturing industry by sector
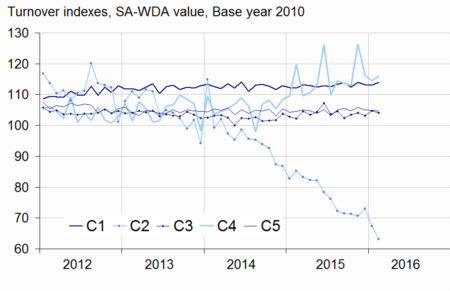
- Source: INSEE
tableauIRtab5 – Variation of the turnover in industry and construction
| Change in % | |||||
|---|---|---|---|---|---|
| NA : A 10, (A 17) | Weight** | Feb./ Jan. | Jan./ Dec. | q-o-q (1) | y-o-y (2) |
| BE: INDUSTRY | 10000 | 0.7 | –0.8 | –1.0 | –0.3 |
| CZ: MANUFACTURING INDUSTRY | 8346 | 0.0 | –0.6 | –0.7 | –0.3 |
| Of which Exports | 2677 | –0.3 | –1.9 | –1.9 | –0.3 |
| (C1): Manufacture of food products and beverages | 1685 | 1.0 | –0.1 | 0.0 | 0.8 |
| (C2): Manufacture of coke and refined petroleum products | 561 | –6.3 | –7.9 | –4.6 | –20.2 |
| (C3): Electrical and electronic equipment; machine equipment | 953 | –0.6 | 1.5 | 0.6 | 1.0 |
| (C4): Manufacture of transport equipment | 1265 | 1.3 | –1.5 | –1.8 | 2.6 |
| (C5): Other manufacturing | 3881 | –0.1 | –0.2 | –0.4 | 0.2 |
| DE: Mining and quarrying; energy; water supply; waste management | 1654 | 3.7 | –1.8 | –2.6 | –0.6 |
| FZ: CONSTRUCTION | 10000 | 1.3 | –0.3 | 0.2 | 0.1 |
- ** 10000=B...E and F
- (1) Quarter-on-quarter: last three months / previous three months
- (2) Year-on-year : last three months / same three months of previous year
- The codes correspond to different levels of aggregation of the NACE classification.
- Source: INSEE
Rebound in transport equipment (+1.3%)
The turnover in the manufacture of transport equipment recovered in February (+1.3%, after −1.5% in January). The rebound is due to the manufacture of motor vehicles, trailers and semi-trailers (+5.2%, after −3.7%), while the turnover fell back in the manufacture of other transport equipment (−2.0%, after +0.5%).
Rise in food products and beverages (+1.0%)
The turnover rose in February in the manufacture of food products and beverages (+1.0%) after a virtual stability in January (−0.1%).
New sharp fall in coke and refined petroleum products (−6.3%)
In February, the turnover went on declining dramatically in the manufacture of coke and refined petroleum products (−6.3%, after −7.9% in January).
Decrease in equipments (−0.6%)
The turnover in the electrical and electronic equipment and machine equipment turned down in February (−0.6%, after +1.5%). The fall concerned mainly the manufacture of computer, electronic and optical products (−1.7%). The turnover remained virtually stable in the manufacture of machinery and equipment n.e.c. (−0.1%) and stabilised in the manufacture of electrical equipment.
Virtual stability in other manufacturing (−0.1%)
The turnover in other manufacturing levelled off in February (−0.1% after −0.2%). It dropped in the manufacture of chemicals and chemical products (−1.2%) and in the manufacture of basic metals and fabricated metal products (−0.8%), while it grew in other manufacturing: repair and installation (+1.1%) and in the manufacture of basic pharmaceutical products and pharmaceutical preparations (+1.2%).
Revisions: +0.6 points in January in the manufacturing industry
In the manufacturing industry, the evolution of the turnover in January was revised upwards, at −0.5% instead of −1.1% published previously. It was revised by +0.4 points in the industry as a whole (−0.7%, instead of −1.1%).
tableauIRtab8 – Indexes of turnover in industry and construction
| Change in % | |||||
|---|---|---|---|---|---|
| Industries: | Weight* | Feb. 2016 | Feb./ Jan. | Jan./ Dec. | q-o-q (1) |
| BE: INDUSTRY | 10000 | 106.9 | 0.7 | –0.8 | –1.0 |
| CZ: MANUFACTURING INDUSTRY | 8346 | 105.5 | 0.0 | –0.6 | –0.7 |
| of which Exports | 2677 | 110.4 | –0.3 | –1.9 | –1.9 |
| (C1): Man. of food products and beverages | 1685 | 114.1 | 1.0 | –0.1 | 0.0 |
| of which Exports | 285 | 118.3 | 1.5 | 1.3 | 0.2 |
| (C2): Man. of coke and refined petroleum products | 561 | 63.1 | –6.3 | –7.9 | –4.6 |
| (C3): Electrical and electronic equipment; machine equipment | 953 | 104.1 | –0.6 | 1.5 | 0.6 |
| of which Exports | 469 | 102.1 | –1.0 | 1.5 | –0.2 |
| [CI] Man. of computer, electronic and optical products | 306 | 100.3 | –1.7 | 2.0 | 0.3 |
| [CJ] Man. of electrical equipment | 245 | 98.0 | 0.0 | 0.1 | –0.9 |
| [CK] Man. of machinery and equipment n.e.c. | 402 | 110.7 | –0.1 | 2.0 | 1.7 |
| (C4): Man. of transport equipment | 1265 | 116.0 | 1.3 | –1.5 | –1.8 |
| of which Exports | 617 | 122.4 | –0.1 | –5.5 | –2.0 |
| [CL1] Man. of motor vehicles, trailers and semi-trailers | 702 | 100.3 | 5.2 | –3.7 | –3.1 |
| [CL2] Man. of other transport equipment | 562 | 135.5 | –2.0 | 0.5 | –0.7 |
| (C5): Other manufacturing | 3881 | 104.8 | –0.1 | –0.2 | –0.4 |
| of which Exports | 1237 | 108.3 | –0.5 | –0.2 | –2.7 |
| [CB] Man. of textiles, wearing apparel, leather and related products | 188 | 108.1 | –0.1 | –0.9 | 0.0 |
| [CC] Man. of wood and paper products; printing and reproduction of recorded media | 436 | 97.6 | –0.2 | –0.4 | –0.1 |
| [CE] Man. of chemicals and chemical products | 745 | 100.3 | –1.2 | –1.5 | 0.0 |
| [CF] Man. of basic pharmaceutical products and pharmaceutical preparations | 304 | 108.9 | 1.2 | –4.7 | 0.9 |
| [CG] Man. of rubber and plastics products, and other non-metallic mineral products | 629 | 102.9 | 0.4 | –1.5 | –0.6 |
| [CH] Man. of basic metals and fabricated metal products, except machinery and equipment | 926 | 101.6 | –0.8 | 2.4 | –1.6 |
| [CM] Other manufacturing; repair and installation of machinery and equipment | 653 | 118.1 | 1.1 | 1.2 | –0.1 |
| DE: Mining and quarrying; energy, water supply, sewerage, waste management | 1654 | 114.1 | 3.7 | –1.8 | –2.6 |
| [BZ] Mining and quarrying | 70 | 91.8 | –3.2 | 0.4 | 1.8 |
| [DZ] Electricity, gas, steam and air-conditioning supply | 1205 | 115.8 | 3.8 | –1.6 | –3.6 |
| [EZ] Water supply; sewerage, waste management and remediation | 379 | 112.5 | 4.5 | –2.8 | 0.1 |
| FZ: CONSTRUCTION | 10000 | 104.7 | 1.3 | –0.3 | 0.2 |
- ** 10000=B...E and F
- (1) Quarter-on-quarter: last three months / previous three months
- Source: INSEE
tableauIRtab7 – Measure of variations' revisions
| Jan./ Dec. | Dec./ Nov. | Nov./ Oct. | Q4 2015/ Q3 2015 | 2015/ 2014 | |
|---|---|---|---|---|---|
| Industry (BE) | 0.36 | –0.48 | 0.12 | –0.25 | –0.09 |
| raw serie | –0.46 | –0.03 | –0.01 | 0.10 | –0.11 |
| SA-WDA coeff. | 0.83 | –0.45 | 0.14 | –0.35 | 0.02 |
| Manufacturing industry (CZ) | 0.57 | –0.27 | 0.20 | –0.06 | –0.04 |
| raw serie | 0.13 | –0.04 | –0.02 | 0.09 | –0.04 |
| SA-WDA coeff. | 0.44 | –0.23 | 0.22 | –0.15 | 0.01 |
- How to read it: in the manufacturing industry, the SA-WDA evolution between December 2015 and January 2016 is revised by +0.57 points: +0.13 points are due to the raw serie's revision and +0.44 points to the new calculation of the SA-WDA.
- Source : INSEE
Documentation
Methodology (pdf,140 Ko)
Pour en savoir plus
Time series : Turnover indices (VAT)
