


 26 February 2016
2016- n° 55In Q4 2015, producer prices of services sold to French businesses were virtually
stable Services producer price indices - 4th Quarter 2015
26 February 2016
2016- n° 55In Q4 2015, producer prices of services sold to French businesses were virtually
stable Services producer price indices - 4th Quarter 2015
In the fourth quarter of 2015, producer prices of services sold to French businesses were almost unchanged for the second consecutive quarter (+0.1% as in the third quarter).
SPPI, production sold to French businesses
In the fourth quarter of 2015, producer prices of services sold to French businesses were almost unchanged for the second consecutive quarter (+0.1% as in the third quarter).
Price rise for almost all services
Prices for information and communication services recovered sharply in Q4 (+1.2% after −0.7%). As every year at this time, prices for radio and television broadcasting services rose strongly.
Prices for scientific and technical services grew (+0.6%), driven above all by the seasonal rise in media representation services (+9.1%) and by those for management consulting services (+1.7%).
Prices for real estate activities increased again (+0.4% following +0.3%), driven up by prices for renting and operating services and by management services of real estate on a fee or contract basis (+0.4% for both).
Prices for administrative and support services advanced slightly (+0.2%): the rise in prices for employment services (+0.8%) was partially offset by the fall in prices for renting and leasing services and by the seasonal fall in prices for travel sale and arrangement (−5.0%).
Decrease in prices for transportation and storage
Prices for transportation and storage services declined (−0.8% after −0.1%), mainly due to seasonal fall in air transport services. Prices for freight transport services by road (–0.3%) contributed also to the fall in prices for this sector.
SPPI, production sold to households in France
Producer prices of services sold to households in France declined sharply in Q4 (−1.8% following +1.7%). In particular, prices for real estate activities slid (−1.3%). Prices for tourisme-related services decreased seasonally, especially those for accommodation and food services (−3.4%) and those for transportation and storage (−3.3%).
SPPI, production sold on foreign markets
Producer prices of services sold on foreign markets fell back this quarter (−0.9% after +0.8%), especially prices for transportation and storage (–3.8%). On the contrary, prices for management consulting services strengthened (+1.9% following +0.1%) and those for IT services continued to rise (+0.7% after +2.1%).
SPPI (all markets)
In the fourth quarter of 2015, on all markets, services producer prices dipped (−0.5% after +0.6%). Year over year, they rose by 0.4%.
graphiqueGraphique1 – Producer price indices for all services.
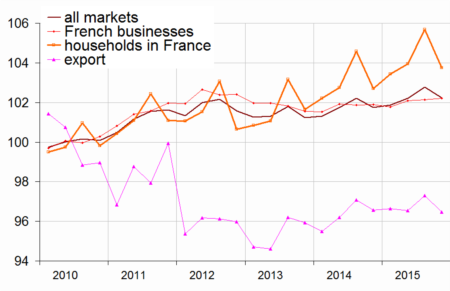
- reference year: 2010
- Source: INSEE
graphiqueGraphique2 – Producer price indices of services sold to French businesses
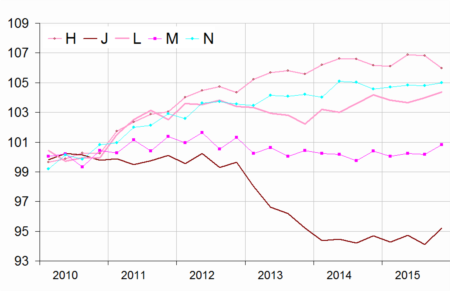
- reference year: 2010
- Source: INSEE
graphiqueGraphique3 – Services producer price indices, all markets
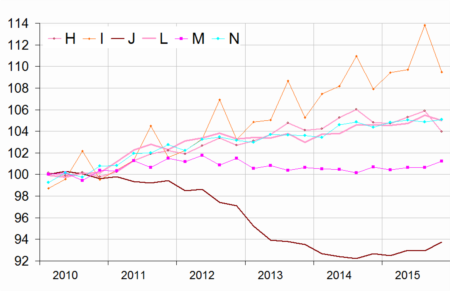
- reference year: 2010
- Source: INSEE
tableauTableau1 – Services producer price indices, by sectors:
| Sections and choices of | Weight | Indices | Change in % | |
|---|---|---|---|---|
| levels in NAF rev.2 | 2015T04 | Q/Q-1 | Q/Q-4 | |
| Prices of services sold to French businesses (BtoB) | ||||
| HN : all services | 1000 | 102.2 | 0.1 | 0.3 |
| H : transport. and storage | 187 | 106.0 | –0.8 | –0.2 |
| 49.41 : freight trans. by road | 65 | 104.5 | –0.3 | –1.0 |
| J : information and comm. | 222 | 95.2 | 1.2 | 0.6 |
| 62 : IT services | 87 | 102.2 | 0.4 | 0.6 |
| L : real estate activities | 100 | 104.4 | 0.4 | 0.2 |
| M : prof.. scient. and tech. | 200 | 100.8 | 0.6 | 0.4 |
| 69 : legal and accounting | 38 | 105.1 | –0.2 | 0.3 |
| 70.2 : mgmt. consulting serv. | 43 | 105.3 | 1.7 | 3.5 |
| 71.12 : engineering | 64 | 98.1 | 0.1 | –0.4 |
| 73.1 : advertising | 26 | 95.8 | 3.4 | –0.7 |
| N : administ. and support | 260 | 105.0 | 0.2 | 0.4 |
| 77 : renting & leasing serv. | 83 | 99.3 | –0.3 | –0.9 |
| 78 : employment activities | 50 | 107.9 | 0.8 | 0.2 |
| 81 : services to buildings and landscape activities | 28 | 106.1 | 0.2 | 1.1 |
| S95 : repair of computers and person. and household goods | 9 | 105.3 | 0.7 | –0.6 |
| Prices of services sold to households in France (BtoC) | ||||
| HN : all services | 1000 | 103.8 | –1.8 | 1.0 |
| H : transport. and storage | 168 | 107.1 | –3.3 | 0.5 |
| I : accomodation and food | 337 | 109.5 | –3.4 | 1.4 |
| J : information and comm. | 186 | 89.9 | 0.1 | 2.2 |
| L : real estate activities | 177 | 105.6 | –1.3 | 0.5 |
| M : prof.. scient. and tech. | 71 | 103.3 | 0.1 | 1.0 |
| N : administ. and support | 43 | 99.1 | –0.4 | –0.4 |
| S95 : repair of computers and person. and household goods | 18 | 109.4 | 0.5 | 0.3 |
| Export prices of services (BtoE) | ||||
| HN : all services | 1000 | 96.5 | –0.9 | –0.6 |
| H : transport. and storage | 473 | 91.3 | –3.8 | –6.2 |
| 49.41 : freight transp. by road | 64 | 107.8 | –0.1 | 0.1 |
| 51.21 : freight air transport | 21 | 123.5 | 2.8 | –6.8 |
| 53 : postal and courier serv. | 13 | 122.9 | 0.0 | 7.7 |
| JB : telecommunications | 51 | 61.8 | –0.2 | 10.1 |
| 62 : IT services | 23 | 102.5 | 0.7 | 2.0 |
| 70.2 : mgmt. consulting serv. | 48 | 98.0 | 1.9 | 0.8 |
| 71.12 : engin. & tech. consult. | 66 | 104.1 | 0.0 | 0.2 |
| 77.40 : licensing services | 146 | 110.9 | 0.3 | 6.3 |
| Prices of services sold on all markets (BtoAll) | ||||
| HN : all services | 1000 | 102.2 | –0.5 | 0.4 |
| H : transport. and storage | 200 | 104.0 | –1.8 | –1.0 |
| I : accomodation and food | 98 | 109.5 | –3.8 | 1.4 |
| J : information and comm. | 208 | 93.7 | 0.9 | 1.1 |
| L : real estate activities | 113 | 105.0 | –0.5 | 0.4 |
| M : prof.. scient. and tech. | 167 | 101.2 | 0.6 | 0.5 |
| N : administ. and support | 204 | 105.1 | 0.2 | 0.7 |
| S95 : repair of computers and person. and household goods | 11 | 107.0 | 0.6 | –0.2 |
- s: statistical confidentiality
- Source: INSEE
tableauTableau3 – Measure of revision
| Services producer price indices | 2015T03 / 2015T02 |
|---|---|
| - services sold to all markets | 0.1 |
| - services sold to French businesses | 0.1 (1) |
| - services sold to consumers in France | –0.1 |
| - export of services | 0.8 |
- (1) How to read it: the change in French business index between the second and the third quarter 2015 published at the end of November was –0.0%. It has been revised at +0.1%; that is to say a revision of +0.1 point.
Documentation
Simplified methodology (pdf,134 Ko)
Pour en savoir plus
Time series : Services producer price indices
