


 12 April 2016
2016- n° 93Slight rise in business start-ups in March 2016 Enterprise births - March 2016
12 April 2016
2016- n° 93Slight rise in business start-ups in March 2016 Enterprise births - March 2016
In March 2016, the number of business births slightly recovered (+0.2% following -0.7% for all entreprises, seasonally and working-day adjusted). The increase in sole proprietorships excluding self-managed micro-entrepreneurs (+1.4%) was offset by the drop in micro-entrepreneurs' registrations (-1.5%).
In March 2016, the number of business births slightly recovered (+0.2% following −0.7% for all entreprises, seasonally and working-day adjusted). The increase in sole proprietorships excluding self-managed micro-entrepreneurs (+1.4%) was offset by the drop in micro-entrepreneurs' registrations (−1.5%).
graphiqueGraph1EN – Business start-ups (sa-wda *)
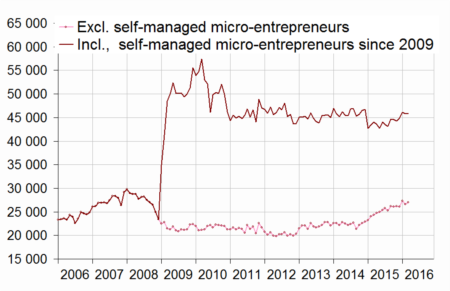
- * Seasonally and working-day adjusted data
- Source: INSEE (Sirene)
tableautab1EN – Business set-ups by month (sa-wda *)
| Dec. 2015 | Jan. 2016 | Feb. 2016 | March 2016 | |
|---|---|---|---|---|
| Excl. self-managed micro-entrepreneurs | 26,106 | 27,303 | 26,611 | 26,972 |
| Variation [m-o-m] % | −0.2 | 4.6 | −2.5 | 1.4 |
| Incl. self-managed micro-entrepreneurs | 44,911 | 46,149 | 45,804 | 45,875 |
| Variation [m-o-m] % | 1.4 | 2.8 | −0.7 | 0.2 |
- * Seasonally and working-day adjusted data
- Source: INSEE (Sirene)
+5.7% year-on-year (quarterly basis)
The raw amount of births added up in the first quarter of 2016 went up clearly compared to the same quarter one year before (+5.7%). Over this period, set-ups excluding self-managed micro-entrepreneurs improved sharply (+14.0% for companies and +11.9% for sole proprietorship start-ups excluding self-managed micro-entrepreneurs). Over the same period micro-entrepreneur's registrations came down by 3.6%. Transportation remained the sector that most contributed to the overall rise.1
tableautab2EN – Business start-ups by type
| Moving total % change * | Moving total | Moving total | ||
|---|---|---|---|---|
| over 3 months | over 12 months | January- March 2016 | January- March 2015 | |
| Total | 5.7 | -1.9 | 150,460 | 142,376 |
| Companies | 14.0 | 7.5 | 50,901 | 44,659 |
| Sole proprietorships | 1.9 | -0.6 | 99,559 | 97,717 |
| Of which excluding self-managed micro-entrepreneurs | 11.9 | 2.6 | 38,757 | 34,643 |
| Of which self-managed micro-entrepreneurs | −3.6 | −1.8 | 60,802 | 63,074 |
- * Total of business start-ups during the last 3 or 12 months compared with the same months a year earlier
- Source: INSEE (Sirene)
−1.9% year-on-year (twelve months basis)
The raw number of business start-ups totted up during the last twelve months decreased by 1.9% year-on-year. This fall was due to the significant drop in self-managed micro-entrepreneurs' set-ups (−18.4%). Conversely, sole proprietorships creations excluding self-managed micro-entrepreneurs shoot up (+25.7%) and companies' start-ups grew sharply (+7.5%).
Two business set-ups out of five are self-managed micro-entrepreneur's registrations
In March 2016, micro–entrepreneurs' registrations amounted to 41.5% of business set-ups over the twelve last months. One year before, the share was 49.9%.
tableautab0EN – Business set-ups distribution by type
| Jan. 2016 | Feb. 2016 | March 2016 | |
|---|---|---|---|
| Companies | 33,0 | 33,2 | 33,4 |
| Sole proprietorships excluding self-managed micro-entrepreneurs | 24,9 | 25,0 | 25,1 |
| Self-managed micro-entrepreneurs | 42,1 | 41,8 | 41,5 |
- Source: INSEE (Sirene)

1 The contribution of a sector to the overall variation is the observed variation of this sector, weighted by the share of this sector in the total number of births.
Business set-ups by economic activity
graphiqueGraph2EN – Trade and business support activities start-ups (sa-wda *)
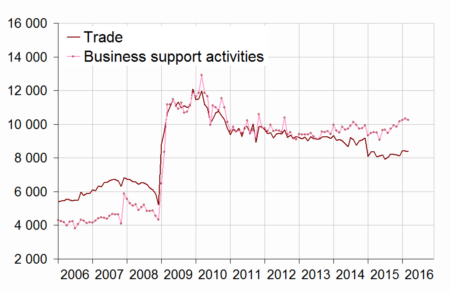
- * Seasonally and working-day adjusted data
- Source : Insee, Sirene
graphiqueGraph3EN – Construction and real estate business set-ups (sa-wda *)
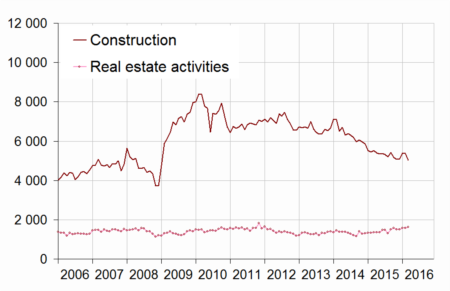
- * Seasonally and working-day adjusted data
- Source : Insee, Sirene
tableautab3EN – Number of business set-ups (incl. self-managed micro-enterprises)
| NA | Jan. 2016 | Feb. 2016 | March 2016 | |
|---|---|---|---|---|
| Total | 46,149 | 45,804 | 45,875 | |
| Industry | BE | 2,084 | 1,817 | 2,120 |
| Of which Manufacturing | C | 1,818 | 1,691 | 1,777 |
| Construction | FZ | 5,401 | 5,361 | 5,019 |
| Wholesale and retail trade, Transport, Accommodation and Food and beverage activities | GI | 13,214 | 13,247 | 13,152 |
| Of which Trade | G | 8,427 | 8,409 | 8,375 |
| Of which Transportation and storage | H | 2,385 | 2,515 | 2,720 |
| Of which Accommodation and food service activities | I | 2,473 | 2,476 | 2,505 |
| Information and communication | JZ | 2,305 | 2,333 | 2,311 |
| Financial and insurance activities | KZ | 1,287 | 1,382 | 1,405 |
| Real estate activities | LZ | 1,568 | 1,567 | 1,622 |
| Business support activities | MN | 10,245 | 10,330 | 10,253 |
| Public administration and defence, education, human health and social work activities | OQ | 5,768 | 5,577 | 5,602 |
| Other services activities | RS | 4,278 | 4,189 | 4,389 |
- * Seasonally and working-day adjusted data
- Source: INSEE (Sirene)
tableautab3bisEN – Fluctuation in the number of business set-ups (incl. self-managed micro-entrepreneurs)
| NA | March 16 / Feb. 16 | Moving total % change** | ||
|---|---|---|---|---|
| sa-wda * | over 3 months | over 12 months | ||
| Total | 0.2 | 5.7 | -1.9 | |
| Industry | BE | 16.7 | 0.8 | -11.5 |
| Of which Manufacturing | C | 5.1 | 1.5 | -13.5 |
| Construction | FZ | −6.4 | −4.0 | −12.7 |
| Wholesale and retail trade, Transport, Accommodation and Food and beverage activities | GI | −0.7 | 11.0 | 0.9 |
| Of which Trade | G | −0.4 | 1.6 | −6.6 |
| Of which Transportation and storage | H | 8.1 | 73.2 | 56.5 |
| Of which Accommodation and food service activities | I | 1.2 | 7.0 | −2.6 |
| Information and communication | JZ | −1.0 | 6.1 | −2.3 |
| Financial and insurance activities | KZ | 1.7 | 4.8 | 6.9 |
| Real estate activities | LZ | 3.5 | 18.5 | 13.8 |
| Business support activities | MN | −0.8 | 8.1 | 1.1 |
| Public administration and defence, education, human health and social work activities | OQ | 0.4 | 3.4 | 1.4 |
| Other services activities | RS | 4.8 | −0.4 | −7.1 |
- * Seasonally and working-day adjusted data
- ** Total of business start-ups during the last 3 or 12 months compared with the same months a year earlier
- Source: INSEE (Sirene)
Pour en savoir plus
Time series : Business demography
