


 15 March 2016
2016- n° 63Consumer prices increased by 0.3% in February 2016; year-on-year, they were down 0.2% Consumer price index - final results - February 2016
15 March 2016
2016- n° 63Consumer prices increased by 0.3% in February 2016; year-on-year, they were down 0.2% Consumer price index - final results - February 2016
In February 2016, the Consumer Prices Index (CPI) grew by 0.3% after -1.0% in January. Seasonally adjusted, it diminished by 0.2%, as in the previous month. Year-on-year, it fell back (-0.2% after +0.2% in January 2016), for the first time since March 2015. The variation in energy prices and service prices explain much this movement. Over one month, the rise in the CPI in February came mainly from the rebound in prices of manufactured products after the end of winter sales and in prices of services tourism-related, although this latter was lower this year. Moreover, petroleum product prices continued to fall in February, while food prices were stable.
Monthly change: +0.3%; year-on-year: −0.2%
In February 2016, the Consumer Prices Index (CPI) grew by 0.3% after −1.0% in January. Seasonally adjusted, it diminished by 0.2%, as in the previous month. Year-on-year, it fell back (−0.2% after +0.2% in January 2016), for the first time since March 2015. The variation in energy prices and service prices explain much this movement. Over one month, the rise in the CPI in February came mainly from the rebound in prices of manufactured products after the end of winter sales and in prices of services tourism-related, although this latter was lower this year. Moreover, petroleum product prices continued to fall in February, while food prices were stable.
Seasonal rebound in manufactured product prices
In February 2016, prices of manufactured products recovered sharply (+1.0% after −3.0% in January; −0.1% year-on-year) due to the end of winter sales. The rebound is particularly pronounced in clothing and footwear (+5.9%; +0.8% year-on-year). To a lesser extent, this effect also contributed to the rise in prices of other products like jewellery, clocks and watches (+1.1%; +1.9% year-on-year), furniture and furnishings (+1.1%; +0.6% year-on-year) and major household appliances (+0.6%; −0.8% year-on-year). However, prices of other products were still edged down owing to promotions : new motor cars (−0.1%; +1.3% year-on-year) and sport equipment (−0.2%; +0.7% year-on-year) especially. Furthermore, prices of health products continued to decline (−0,2%; +3,7% year-on-year).
tableauTableau1IR_English – Detailed figures for various groups definitive variations
| Items | Weight | Index | Percentage change | |
|---|---|---|---|---|
| 2016 | Feb. 2016 | m-on-m change | y-on-y change | |
| a) All households | ||||
| OverAll | 10000 | 99.33 | 0.3 | −0.2 |
| Overall SA* | 10000 | 99.65 | −0.2 | −0.2 |
| Food | 1615 | 99.90 | 0.0 | 0.2 |
| Fresh food | 217 | 98.65 | −0.1 | 0.4 |
| Other food | 1398 | 100.10 | 0.0 | 0.2 |
| Tobacco | 195 | 100.04 | 0.0 | 0.3 |
| Manufactured products | 2651 | 98.79 | 1.0 | −0.1 |
| Clothing and footwear | 414 | 92.96 | 5.9 | 0.8 |
| Medical products | 466 | 98.07 | −0.2 | −3.7 |
| Other manufactured products | 1771 | 100.14 | 0.3 | 0.4 |
| Energy | 773 | 94.06 | −1.0 | −6.8 |
| Petroleum products | 419 | 88.10 | −1.4 | −12.8 |
| Services | 4766 | 100.31 | 0.2 | 0.8 |
| Actual rentals and services for dwellings | 768 | 100.62 | 0.1 | 0.6 |
| Medical services | 598 | 100.25 | 0.2 | 0.2 |
| Transport | 279 | 96.72 | 0.5 | −1.8 |
| Communication | 245 | 99.89 | −0.1 | 0.0 |
| Other services | 2876 | 100.63 | 0.2 | 1.3 |
| Total except rents and tobacco | 9183 | 99.25 | 0.3 | −0.2 |
| Total except tobacco | 9805 | 99.32 | 0.3 | −0.2 |
| b) Urban working-class households or households of employees | ||||
| All products excluding tobacco | 9704 | 99.25 | 0.3 | −0.3 |
| c) Households that belong to the lowest equivalized disposable income quintile - France | ||||
| All products excluding tobacco | 9696 | 99.09 | 0.2 | −0.4 |
- *: seasonally adjusted
- Geographical coverage: France excluding Mayotte
- Source: INSEE - Consumer Price Indexes
Seasonal increase in service prices
As every year, service prices grew in February (+0.2% over one month; +0.8% year-on-year). This rise was less pronounced than in recent years. Indeed, seasonal increase in prices related to accomodation services (+2.7%; +0.8% year-on-year) and those of recreational and sporting services (+0.3% over one month as over one year) are more limited this year, mainly because of the shift of the school holiday dates for Zone C. Besides, telecommunication fees were stable, whereas they had risen sharply in February 2015 (+1.9% over one month). Finally, insurance prices dipped (−0.6%; +2.4% year-on-year) as a result of promotions on motor vehicle insurance tariffs. Conversely, toll facilities were raised in February this year (+1.1%), unlike last year.
Further drop in energy
In February 2016, energy prices fell for the ninth month in a row (−1.0%; −6.8% year-on-year), once again due to the decline in prices of petroleum products (−1.4%; −12.8% year-on-year). Moreover, natural gas and town gas prices slipped back sharply (−1.7%; −8.8 % year on year) after an increase in the previous month (+1.0%). Electricity rates were unchanged over the month (+4.1% year-on-year).
Stability of food prices
In February 2016, food prices were broadly flat. Prices of fresh products fell slightly again (−0.1% after −0.4% in January). Excluding fresh products, food prices were unchanged over the month and increased by 0.2% year-on-year, as in the previous two months.
Decline in core inflation
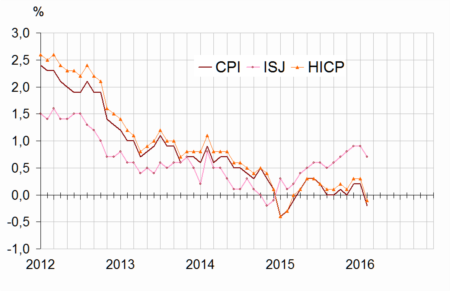
In February 2016, core inflation indicator (ISJ) was stable after an increase by 0.1% in January. Year-on-year, it grew by 0.7%, slightly less quickly than the previous two months (+0.9% in January and December). The Harmonised Index of Consumer Prices (HICP) increased by 0.3% over one month. Year-on-year, it edged down year-on-year (−0.1% after +0.3% in the previous two months).
graphiqueGraphiqueIR_English – Consumer price index (CPI), core inflation (ISJ)* and Harmonised Indices of Consumer Prices (HICP)** year-on-year changes
tableauTableau2IR_English – Detailed figures for Core inflation* and HICP**
| Items | Weight | Index | Percentage change | |
|---|---|---|---|---|
| 2016 | Feb. 2016 | m-on-m change | y-on-y change | |
| Core inflation - All items | 6075 | 100.37 | 0.0 | 0.7 |
| Food excluding fresh products, meat, milk and exotic products | 735 | 100.06 | −0.1 | 0.0 |
| Manufactured products | 2136 | 100.50 | 0.8 | 0.6 |
| Services including actual rentals and services for dwellings | 3204 | 100.54 | −0.2 | 0.9 |
| HICP - All items | 99.32 | 0.3 | −0.1 | |
- * Core inflation indicator excludes public sector prices, the most volatile consumer prices and the tax measures. Seasonally adjusted, this index is calculated for all households in France excluding overseas departments and territories. (in French “indice d'inflation sous-jacent - ISJ)
- **HICP: Harmonised Indices of Consumer Prices are inflation figures designed for international comparison of consumer price inflation between Member states of the European Union. This index is calculated for all households in France (excluding Mayotte).
- Source: INSEE - Consumer Price Indexes
Revisions
Compared to the provisional estimate released on 26 February 2016, the monthly rate of change in the CPI in February 2016 was raised by 0.1 percentage points, from 0.2% to 0.3%.
Pour en savoir plus
