


 10 March 2016
2016- n° 61Employment increased again in Q4 2015 Payroll employment - 4th quarter 2015
10 March 2016
2016- n° 61Employment increased again in Q4 2015 Payroll employment - 4th quarter 2015
Disclaimer: The introduction of the “Déclaration Sociale Nominative“ (DSN) to replace the “bordereau récapitulatif des cotisations” (BRC) may affect transitorily the declarative behavior ofbusinesses. During the ramp-up phase of the DSN, adjustments are made in the statistical processing chain of employment estimates to reflect these changes. These changes are likely to generate more revisions than usual to data. Rise in payroll employment in the market sector In Q4 2015, payroll employment in the non-farm market sectors increased (+31,800 jobs, that is 0.2%) after a slight rise in the previous quarter (+12,900 jobs, that is +0.1%). Excluding temporary work, employment increased slightly (+12,900 jobs, i.e. +0.1%, after −4,400 jobs in Q3 2015). Year-on-year, the principally market sectors created 82,300 jobs (+0.5%). The decline in employment in industry and in construction eased slightly In Q4 2015, employment continued to decline in industry (−8,400 jobs, that is −0.3%) but at a slower pace than the previous quarter (–12,500 jobs, that is −0.4%). It was the same in construction, where 6,600 jobs (−0.5%) were destroyed, after −8,800 in the third quarter. Year-on-year, industry lost 37,700 jobs (−1.2%) whereas construction shed 35,500 jobs (−2.7%). Employment increased in services, notably in temporary employment Temporary workers are recorded in services, regardless of the sector in which they carry out their mission effectively. Temporary employment increased markedly again in Q4 2015 : +18,900 jobs (+3.3%) after +17,400 jobs in Q3 2015. At the same time, employment in services excluding temporary work accelerated (+27,900 jobs, i.e. 0.3 %, after +16,900 in Q3 2015). Overall, ther pace of job creations increased in the market services sector (+46,800 jobs, that is +0.4%, after +34,200 in the previous quarter, i.e. +0,3%). Year-on-year, temporary employment was very buoyant (+50,600 jobs, i.e. +94%) and the market services sector as a whole created 155,400 jobs (+1.3%) Revisions The payroll employment estimation of the third quarter of 2015 in the principally market sectors is revised upwards by 13,800 jobs. The estimation of the fourth quarter of 2015 is revised upwards by 5,400 jobs compared to the Flash estimate released on 12 February 2016.

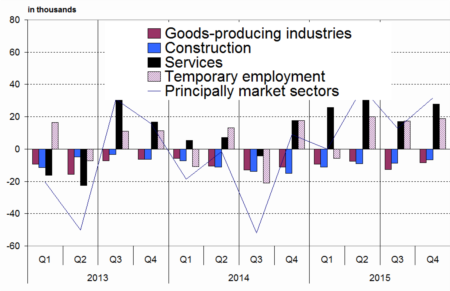
Disclaimer: The introduction of the “Déclaration Sociale Nominative“ (DSN) to replace the “bordereau récapitulatif des cotisations” (BRC) may affect transitorily the declarative behavior ofbusinesses. During the ramp-up phase of the DSN, adjustments are made in the statistical processing chain of employment estimates to reflect these changes. These changes are likely to generate more revisions than usual to data.
Rise in payroll employment in the market sector
In Q4 2015, payroll employment in the non-farm market sectors increased (+31,800 jobs, that is 0.2%) after a slight rise in the previous quarter (+12,900 jobs, that is +0.1%). Excluding temporary work, employment increased slightly (+12,900 jobs, i.e. +0.1%, after −4,400 jobs in Q3 2015). Year-on-year, the principally market sectors created 82,300 jobs (+0.5%).
The decline in employment in industry and in construction eased slightly
In Q4 2015, employment continued to decline in industry (−8,400 jobs, that is −0.3%) but at a slower pace than the previous quarter (–12,500 jobs, that is −0.4%). It was the same in construction, where 6,600 jobs (−0.5%) were destroyed, after −8,800 in the third quarter.
Year-on-year, industry lost 37,700 jobs (−1.2%) whereas construction shed 35,500 jobs (−2.7%).
Employment increased in services, notably in temporary employment
Temporary workers are recorded in services, regardless of the sector in which they carry out their mission effectively.
Temporary employment increased markedly again in Q4 2015 : +18,900 jobs (+3.3%) after +17,400 jobs in Q3 2015. At the same time, employment in services excluding temporary work accelerated (+27,900 jobs, i.e. 0.3 %, after +16,900 in Q3 2015).
Overall, ther pace of job creations increased in the market services sector (+46,800 jobs, that is +0.4%, after +34,200 in the previous quarter, i.e. +0,3%).
Year-on-year, temporary employment was very buoyant (+50,600 jobs, i.e. +9.4%) and the market services sector as a whole created 155,400 jobs (+1.3%)
tableautableau_1 – Payroll employment change in the competitive sector : thousands …
| Change in 3 months | Change in 1 year | Level | ||
|---|---|---|---|---|
| 2015 | 2015 | 2015 | 2015 | |
| Q3 | Q4 | Q4 | Q4 | |
| Principally market sectors | 12,9 | 31,8 | 82,3 | 15947,7 |
| Goods-producing industries excl. Construction | –12,5 | –8,4 | –37,7 | 3120,6 |
| Manufacturing | –12,7 | –7,6 | –36,9 | 2751,5 |
| Construction | –8,8 | –6,6 | –35,5 | 1313,4 |
| Services | 34,2 | 46,8 | 155,4 | 11513,7 |
| of which : Temporary employment | 17,4 | 18,9 | 50,6 | 586,2 |
| Principally non-market sectors (*) | 0,5 | 6,5 | 19,9 | 2012,7 |
| Total competitive sector (*) | 13,4 | 38,3 | 102,1 | 17960,5 |
tableautableau_2 – ... Percentage
| Change in 3 months | Change in 1 year | ||
|---|---|---|---|
| 2015 | 2015 | 2015 | |
| Q3 | Q4 | Q4 | |
| Principally market sectors | 0,1 | 0,2 | 0,5 |
| Goods-producing industries excl. Construction | –0,4 | –0,3 | –1,2 |
| Manufacturing | –0,5 | –0,3 | –1,3 |
| Construction | –0,7 | –0,5 | –2,7 |
| Services | 0,3 | 0,4 | 1,3 |
| of which : Temporary employment | 3,2 | 3,3 | 9,4 |
| Principally non-market sectors (*) | 0,0 | 0,3 | 1,0 |
| Total competitive sector (*) | 0,1 | 0,2 | 0,5 |
tableautableau_4 – Payroll employment change in the competitive sector (*)
| Code | Change in 3 months | Change in 1 year | Level | ||
|---|---|---|---|---|---|
| Naf | 2015 | 2015 | 2015 | 2015 | |
| rev.2 | Q2 | Q3 | Q3 | Q3 | |
| DE | Electricity, gas, steam, and air conditioning supply ; water supply, sewerage, waste management and remediation activities | 0,2 | –0,8 | –0,8 | 369,1 |
| C1 | Manufacture of food products beverage and tobacco products | –1,0 | 1,9 | 1,4 | 550,2 |
| C2 | Manufacture of coke, and refined petroleum products | 0,0 | –0,1 | –0,1 | 9,4 |
| C3 | Manufacture of computer, electronic and electrical products; manufacture of machinery and equipment | –2,1 | –2,4 | –8,3 | 424,8 |
| C4 | Manufacture of transport equipment | –1,4 | –1,5 | –5,5 | 346,0 |
| C5 | Other manufacturing | –8,2 | –5,5 | –24,4 | 1421,1 |
| FZ | Construction | –8,8 | –6,6 | –35,5 | 1313,4 |
| GZ | Wholesale and retail trade ; repair of motor vehicles and motorcycles | 3,4 | 8,4 | 24,5 | 3023,9 |
| HZ | Transportation and storage | –1,2 | 1,7 | 3,3 | 1340,8 |
| IZ | Accommodation and food service activities | 0,5 | 4,6 | 19,4 | 1006,7 |
| JZ | Information and communication | 1,6 | 2,7 | 5,1 | 713,0 |
| KZ | Financial and insurance activities | 2,2 | 0,2 | 9,3 | 854,8 |
| LZ | Real estate activities | 0,5 | 0,5 | 2,1 | 233,7 |
| MN | Professional, scientific and technical activities; administrative and support service activities | 24,9 | 31,0 | 87,8 | 3057,0 |
| of which : Temporary employment | 17,4 | 18,9 | 50,6 | 586,2 | |
| OQ | Public administration and defence ; compulsory social security; education; human health and social work activities | 0,5 | 6,5 | 19,9 | 2012,7 |
| RU | Other service activities | 2,4 | –2,3 | 4,0 | 1283,9 |
- (*) Excl. Agriculture and public employees in non-market sectors (administration, health, education and social activity)
- Source : INSEE
graphiqueGraph2 – Evolution of principally market sectors
- Source: INSEE
Revisions
The payroll employment estimation of the third quarter of 2015 in the principally market sectors is revised upwards by 13,800 jobs. The estimation of the fourth quarter of 2015 is revised upwards by 5,400 jobs compared to the Flash estimate released on 12 February 2016.
Documentation
Methodology (pdf,135 Ko)
Pour en savoir plus
