


 29 April 2016
2016- n° 116In February 2016, the sales volume soared in household services but decreased in
trade and repair of motor vehicles and motorcycles Sales volume in the retail trade and personal services - February 2016
29 April 2016
2016- n° 116In February 2016, the sales volume soared in household services but decreased in
trade and repair of motor vehicles and motorcycles Sales volume in the retail trade and personal services - February 2016
In February 2016, the sales volume soared in household services (+11.7% after +1.1% in January). It increased slightly in retail trade, except of motor vehicles and motorcycles (+0.3%) and more sustainedly in accommodation and food service activities (+1.4%). On the contrary, it fell back in trade and repair of motor vehicles and motorcycles (-1.4%).

Warning: Since the publication of the indexes of January, 2016 on March 31st, the turnover index series are produced according to a new process that improves their quality. The series have been recalculated over the period 1999-2015. Further information concerning these changes is available on t he Web page of this inde x .
In February 2016, the sales volume soared in household services (+11.7% after +1.1% in January). It increased slightly in retail trade, except of motor vehicles and motorcycles (+0.3%) and more sustainedly in accommodation and food service activities (+1.4%). On the contrary, it fell back in trade and repair of motor vehicles and motorcycles (−1.4%).
graphiqueGraph1_Anglais – Volume of sales in the retail trade and personal services
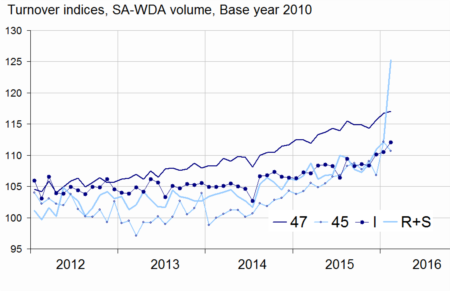
- Source: INSEE
Slight increase in retail trade
In January 2016, the sales volume grew slightly in retail trade, except of motor vehicles and motorcycles (+0.3% after +1.0% in January). According to early estimates, it should decline in March (−0.7%).
While the sales volume increased in non specialised stores (+0.9%), it was virtually stable in specialised stores (−0.1%): rose in retail sale of automotive fuel (+1.1%) and in retail sale of food, beverages and tobacco (+1.4%) on one side and decreased in retail sale of other goods (clothings, perfumes, etc: −0.6%) and in the retail sale of other household equipment (home appliance, furniture, etc: −0.5%) on the other side.
The sales volume in retail trade, except of motor vehicles and motorcycles increased quarter-on-quarter (+1.6%) and sharply year on year (+3.8%).
tableauTab1_anglais – Sales volume in the retail trade and personal services
| Change in % | |||||
|---|---|---|---|---|---|
| NACE Classification | Weight | Feb./ Jan. | Jan./ Dec. | q-o-q (1) | y-o-y (2) |
| 47 Retail trade, except of motor vehicles and motorcycles | 1000 | 0.3 | 1.0 | 1.6 | 3.8 |
| 471 Retail sale in non-specialized stores | 370 | 0.9 | 0.0 | 0.6 | 1.8 |
| 472 to 477 Retail sale in specialized stores | 572 | –0.1 | 1.5 | 2.1 | 4.9 |
| 478 and 479 Retail trade not in stores | 58 | 0.9 | 1.4 | 2.0 | 4.3 |
| 45 Trade and repair of motor vehicles and motorcycles | 1000 | –1.4 | 5.1 | 1.2 | 5.5 |
| I Accommodation and food service activities | 1000 | 1.4 | 0.3 | 2.3 | 4.0 |
| R+S Household services | 1000 | 11.7 | 1.1 | 7.6 | 9.2 |
| R Arts, entertainment and recreation | 422 | 26.1 | 3.7 | 15.3 | 17.8 |
| S Other service activities | 578 | 0.1 | –0.9 | 1.7 | 2.7 |
- (1) Quarter-on-quarter: last three months / previous three months.
- (2) Year-on-year: last three months / same three months of the previous year.
- The codes correspond to different levels of aggregation of the classification NAF rev.2
- Source: INSEE
tableauTabprecoce_anglais – Sales volume in the retail trade: early estimate*
| Change in % | ||
|---|---|---|
| Mar 2016/ Feb. 2016 | Mar 2016/ Mar 2015 | |
| 47 Retail trade, except of motor vehicles and motorcycles | –0.7 | 3.9 |
- * Econometric estimate from a set of sources available within 30 days after the end of the reference month
- Source: INSEE
Decrease in trade and repair of motor vehicles and motorcycles
The sales volume in retail trade and repair of motor vehicles and motorcycles declined in February (−1.4% after +5.1% in January) and this downturn affected mainly the sale of motor vehicles (−1.4% after +4.3%) and the sale of motor vehicle parts and accessories (−2.4% after +8.3%). However, the sales volume improved significantly in sale, maintenance and repair of motorcycles and related parts and accessories (+9.2%)
The sales volume of the whole sector grew over the last three months (+1.2%) and strongly year-on-year (+5.5%).
tableauTab2_anglais – Sales volume in the retail trade and personal services
| Change in % | |||||
|---|---|---|---|---|---|
| Nace Classification | Weight | Feb. 2016 | Feb./ Jan. | Jan./Dec. | q-o-q (1) |
| 47 Retail trade, except of motor vehicles and motorcycles | 1000 | 117.1 | 0.3 | 1.0 | 1.6 |
| 471 Non-specialised stores | 370 | 110.3 | 0.9 | 0.0 | 0.6 |
| 472 to 477 Specialised stores | 572 | 121.1 | –0.1 | 1.5 | 2.1 |
| 472 Retail sale of food, beverages and tobacco in specialised stores | 48 | 130.8 | 1.4 | 0.6 | 3.1 |
| 473 Retail sale of automotive fuel | 77 | 101.1 | 1.1 | 0.9 | 3.8 |
| 474 Retail sale of information and communication equipment | 28 | 176.9 | –0.1 | 1.9 | 1.2 |
| 475 Retail sale of other household equipment | 113 | 105.8 | –0.5 | 2.7 | 3.1 |
| 476 Retail sale of cultural and recreation goods | 48 | 106.6 | 0.0 | 1.2 | 0.9 |
| 477 Retail sale of other goods in specialised stores | 259 | 128.6 | –0.6 | 1.4 | 1.6 |
| 478 et 479 Retail trade not in stores | 58 | 120.3 | 0.9 | 1.4 | 2.0 |
| 45 Wholesale and retail trade and repair of motor vehicles and motorcycles | 1000 | 110.7 | –1.4 | 5.1 | 1.2 |
| 451 Sale of motor vehicles | 671 | 106.3 | –1.4 | 4.3 | 2.2 |
| 452 Maintenance and repair of motor vehicles | 78 | 103.5 | –0.3 | 2.3 | 1.8 |
| 453 Sale of motor vehicle parts and accessories | 227 | 127.2 | –2.4 | 8.3 | –1.8 |
| 454 Sale, maintenance and repair of motorcycles and related parts and accessories | 24 | 98.5 | 9.2 | –0.5 | 8.3 |
| I Accommodation and food service activities | 1000 | 112.1 | 1.4 | 0.3 | 2.3 |
| 55 Accommodation | 239 | 105.4 | 2.0 | 1.3 | 0.3 |
| 56 Food and beverage service activities | 761 | 114.2 | 1.3 | 0.0 | 2.9 |
| 561 Restaurants… | 560 | 114.5 | 0.5 | 0.3 | 3.1 |
| 562 Event catering… | 119 | 107.8 | 5.6 | –1.7 | 1.1 |
| 563 Beverage serving activities | 82 | 120.9 | 1.1 | 0.4 | 4.4 |
| R+S Household services | 1000 | 125.3 | 11.7 | 1.1 | 7.6 |
| R Arts, entertainment and recreation | 422 | 149.2 | 26.1 | 3.7 | 15.3 |
| 90 Creative, arts and entertainment activities | 116 | 113.3 | 5.0 | 4.8 | 0.2 |
| 91 Libraries, archives, museums… | 10 | 128.4 | 0.7 | –4.9 | 4.8 |
| 92 Gambling and betting activities | 106 | 113.1 | 1.4 | –2.7 | 2.6 |
| 93 Sports activities and amusement... | 190 | 192.5 | 50.3 | 7.1 | 32.0 |
| S Other service activities | 578 | 107.7 | 0.1 | –0.9 | 1.7 |
| 95 Repair of computers… | 206 | 90.9 | –0.4 | –1.8 | 0.5 |
| 96 Other personal service activities | 372 | 117.1 | 0.3 | –0.5 | 2.3 |
- (1) Quarter-on-quarter: last three months / previous three months.
- Source: INSEE
Increase in accommodation, and food service activities
The sales volume in accommodation and food service activities rose in February (+1.4% after +0.3% in January). The increase affected all the sector whether it was accommodation (+2.0%) or food and beverage service activities (+1.3%), mainly event catering and other food services (+5.6%).
The sales volume of the whole sector increased sharply quarter-on-quarter (+2.3%) and year-on-year (+4.0%).
Big jump in household services
In February, the sales volume in household services soared (+11.7%). The strong increase was driven up by sports activities and amusement (+50.3%) due to sales of UEFA EURO 2016 tickets and also by creative, arts and entertainment activities (+5.0%).
The sales volume in household services rose significantly over the last three months (+7.6%) and year-on-year (+9.2%).
Revisions
The change of the sales volume for January 2016 has been raised by 0.5 points in retail trade and repair of motor vehicles and motorcycles, from +4.6% to +5.1%. Also, the variation in accommodation and food service activities and in household services has been raised by 0.1 points. It was unchanged in retail trade, except of motor vehicles and motorcycles.
In March, turnover in large-scale food retailing declined
In March 2016, the turnover in large-scale food retailing declined (−1.3% after +1.7% in February). The fall was stronger for sales of food products (−1.7%) than for the sales of non-food products (–0.5%). Sales of automotive fuel stalled (−0.1%).
tableauTab3_anglais – Monthly turnover indices in large-scale food retailing
| Change in % | ||||
|---|---|---|---|---|
| Mar 16/ Feb. 16 | Feb./Jan. | q-o-q (1) | y-o-y (1) | |
| Turnover | –1.3 | 1.7 | 1.0 | 0.3 |
| Including | ||||
| Sales of food products | –1.7 | 1.5 | 0.2 | 1.5 |
| Sales of non-food products | –0.5 | 1.9 | 2.8 | –0.3 |
| Sales of automotive fuel | –0.1 | 1.6 | –0.6 | –8.1 |
- (1) Quarter-on-quarter: last three months / previous three months.
- Source: INSEE - Monthly survey on large scale food retailing (Emagsa)
Documentation
Methodology (pdf,121 Ko)
Pour en savoir plus
