


 24 September 2015
2015- n° 231In September 2015, the business climate in manufacturing has increased again Monthly business survey (goods-producing industries) - September 2015
24 September 2015
2015- n° 231In September 2015, the business climate in manufacturing has increased again Monthly business survey (goods-producing industries) - September 2015
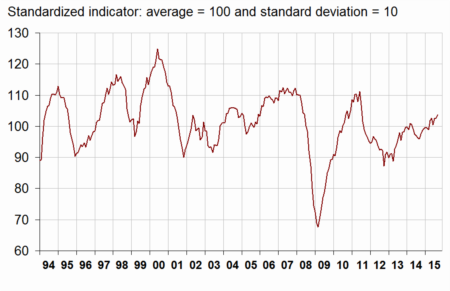
According to the business managers surveyed in September 2015, the business climate in industry has increased again: the composite indicator which measures it has risen by one point and has reached its highest level (104) since August 2011, above its long-term average (100).
Manufacturing industry
According to the business managers surveyed in September 2015, the business climate in industry has increased again: the composite indicator which measures it has risen by one point and has reached its highest level (104) since August 2011, above its long-term average (100).
graphiqueGraphang1 – Business climate in industry - Composite indicator
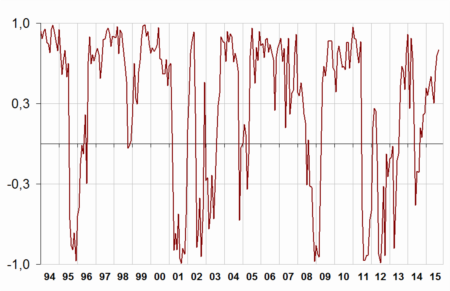
The turning-point indicator is still increasing in the zone indicating a favourable economic outlook.
graphiqueGraphang2 – Turning-point indicator
In September 2015, the balance of opinion on past activity has bounced back (+3 points) after having declined in August to its long-term level. Industrialists are increasingly optimistic on their personal production expectations: the corresponding balance, rising by 6 points, has reached its highest level since July 2011.
The opinion of the industrialists on general production expectations of the sector has improved again (+4 points). The corresponding balance of opinion is at its highest level since July 2011, significantly above their mean level.
In September, while global export order books have decreased, albeit remaining above its long-term level, export order books were stable.
Finally, industrialists are once again more numerous to judge that stocks of finished products are above the normal, the corresponding balance of opinion rising by 2 points.
tableautableau1 – Industrialists' opinion on manufacturing industrial activity
| Manufacturing industry | Ave.* | June 15 | July 15 | Aug. 15 | Sept. 15 |
|---|---|---|---|---|---|
| Composite indicator | 100 | 100 | 102 | 103 | 104 |
| Past activity | 4 | 5 | 9 | 4 | 7 |
| Finished-goods inventory | 13 | 7 | 7 | 14 | 16 |
| Global order books | –18 | –22 | –17 | –12 | –15 |
| Export order books | –14 | –14 | –8 | –9 | –9 |
| Personal production expectations | 5 | 7 | 5 | 8 | 14 |
| General production expectations | –9 | –3 | 0 | 3 | 7 |
- * Long-term average since 1976.
- Source : Monthly business survey - Insee
Sector-based analysis
MAN. OF FOOD PRODUCTS AND BEVERAGES
In the manufacture of food products and beverages, the balance on past activity is virtually stable, below its long-term average. The one on expected activity has decreased but remains above the normal. The balance on stocks of finished products is stable to its mean level. Global and export order books are also stable.
MACHINENERY AND EQUIPMENT GOODS
In the manufacture of machinery and equipment goods, the balance on past activity has dropped to a level well below its long-term average. On the contrary, the balance of opinion on production expectations has picked up and has reached a level superior to the normal. The balance on stocks of finished products is virtually stable, close to its average. Global order books have decreased a little and export order books are stable; the corresponding balances of opinion are inferior to their long-term average.
MAN. OF TRANSPORT EQUIPMENT
Man. of motor vehicles, trailers and semi trailers
In the manufacture of motor vehicles, trailers and semi trailers, the balance on past activity has continued to fall and has reached a level close to its long-term average. Conversely, the one on production prospects has taken off and has become significantly higher to its mean level. Order books are virtually stable well above the normal. Stocks of finished goods are considered to be lower, the corresponding balance of opinion has become slightly inferior to its long-term average.
Man. of other transport equipment
In the manufacture of other transport equipment, while the balance on past activity, already below its mean level, has diminished, the one on production prospects has soared and has reached its highest level since November 2011, significantly above the normal. The balance of opinion on stocks of finished products has stabilized above its long-term level. Order books are also stable above their long-term average.
OTHER MANUFACTURING
In “other manufacturing”, the balance of opinion on past activity has bounced back in pharmaceuticals, has increased again in that of chemicals and is still deteriorating in the manufacture of plastic products and in that of basic metals. The balance on expected activity has climbed in the main sectors, excepted in pharmaceuticals where it is virtually stable, significantly above its mean level. Global and export order books have improved in the manufacture of chemicals, have deteriorated in that of plastic products and are virtually stable in the other sectors. Finally, the balance of opinion on finished-goods inventories has slightly increased in the manufacture of chemicals, in that of plastics products and in that of basic metals; in pharmaceuticals, it has remained stable for three months.
tableautableau2 – Industrialists' opinion in a sector-based approach
| NA* : (A17) et [A 38 et A 64] | Aver.** | July 15 | Aug. 15 | Sept. 15 |
|---|---|---|---|---|
| (C1) Man. of goods products and beverages | ||||
| Past activity | 6 | 18 | –1 | 1 |
| Finished-goods inventory | 12 | 2 | 11 | 12 |
| Global order books | –18 | –11 | –18 | –17 |
| Export order books | –13 | 2 | –4 | –4 |
| Personal production expectations | 7 | 4 | 18 | 12 |
| (C3) Machinery and equipment goods | ||||
| Past activity | 4 | 5 | 6 | –12 |
| Finished-goods inventory | 17 | 18 | 16 | 18 |
| Global order books | –24 | –28 | –26 | –30 |
| Export order books | –22 | –24 | –30 | –31 |
| Personal production expectations | 2 | –9 | –5 | 8 |
| (C4) Man. of transport equipment | ||||
| Past activity | 8 | 38 | 16 | 9 |
| Finished-goods inventory | 14 | 21 | 32 | 27 |
| Global order books | –14 | 4 | 20 | 18 |
| Export order books | –12 | –9 | 1 | 1 |
| Personal production expectations | 8 | –11 | –7 | 50 |
| Man. of motor vehicules, trailers and semi-trailers [CL1] | ||||
| Past activity | 3 | 71 | 18 | 1 |
| Finished-goods inventory | 10 | –7 | 18 | 7 |
| Global order books | –20 | –14 | 14 | 10 |
| Export order books | –14 | –11 | 8 | 10 |
| Personal production expectations | 3 | 5 | –16 | 56 |
| Man. of other transport equipment [CL2] | ||||
| Past activity | 15 | 7 | 11 | –2 |
| Finished-goods inventory | 21 | 51 | 47 | 47 |
| Global order books | –5 | 23 | 26 | 26 |
| Export order books | –10 | –7 | –6 | –5 |
| Personal production expectations | 15 | –17 | –8 | 47 |
| (C5) Other manufacturing | ||||
| Past activity | 1 | 1 | 0 | 6 |
| Finished-goods inventory | 10 | 8 | 7 | 10 |
| Global order books | –20 | –17 | –21 | –22 |
| Export order books | –13 | –2 | –6 | –7 |
| Personal production expectations | 4 | 6 | 10 | 10 |
| Man. of chemicals and chemical products [CE] | ||||
| Past activity | 5 | –10 | 5 | 12 |
| Finished-goods inventory | 6 | 5 | –2 | 3 |
| Global order books | –13 | –8 | –19 | –10 |
| Export order books | –8 | 8 | –1 | –2 |
| Personal production expectations | 13 | 3 | 8 | 14 |
| Man. of basic pharmaceutical products [CF] | ||||
| Past activity | 16 | –30 | –33 | 44 |
| Finished-goods inventory | 9 | 6 | 6 | 5 |
| Global order books | 3 | –2 | –2 | –1 |
| Export order books | 10 | 0 | 3 | 3 |
| Personal production expectations | 15 | 50 | 44 | 43 |
| Man. of rubber and plastics products [CG] | ||||
| Past activity | –3 | 4 | –6 | –20 |
| Finished-goods inventory | 11 | 9 | 7 | 12 |
| Global order books | –25 | –35 | –35 | –40 |
| Export order books | –18 | –6 | –4 | –9 |
| Personal production expectations | –2 | –4 | –8 | 7 |
| Man. of basic metals and fabricated metal products [CH] | ||||
| Past activity | 0 | 20 | 6 | –6 |
| Finished-goods inventory | 7 | 6 | 11 | 16 |
| Global order books | –20 | –17 | –20 | –20 |
| Export order books | –15 | –2 | –10 | –8 |
| Personal production expectations | 1 | 9 | 1 | 10 |
- * NA: aggregated classification, based on the NAF rév.2.
- ** Long-term average since 1976.
- Source: INSEE - Monthly business survey
Documentation
Methodology (pdf,133 Ko)
Pour en savoir plus
Time series : Industry - Activity and demand
