


 23 April 2015
2015- n° 95In April 2015, the business climate has remained over its average in the retail trade
and in the trade and repair of motor vehicles Monthly survey of retailing - April 2015
23 April 2015
2015- n° 95In April 2015, the business climate has remained over its average in the retail trade
and in the trade and repair of motor vehicles Monthly survey of retailing - April 2015
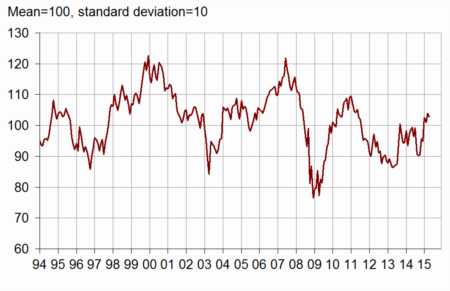
According to the managers surveyed in April 2015, the business climate has remained over its average in the retail trade and in the trade and repair of motor vehicles. The corresponding synthetic indicator is almost stable (-1 point) and has stayed over its long term average since the beginning of the year.
According to the managers surveyed in April 2015, the business climate has remained over its average in the retail trade and in the trade and repair of motor vehicles. The corresponding synthetic indicator is almost stable (-1 point) and has stayed over its long term average since the beginning of the year.
graphiquegraph_indsynt_en – Business climate synthetic indicator
Optimistic business outlook
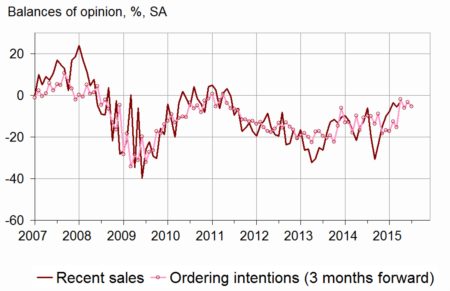
More business leaders than in March have declared a rise in their recent sales. The corresponding balance has significantly progressed in motor car trade but has declined again in retail trade.
Each of the two balances concerning expected sales and ordering intentions has decreased but remains above its average. General business outlook are a little more optimistic.
Stocks have been estimated stable at their standard level.
As many business leaders as over the last month have expected price falls over the next few months.
graphiqueGraph_ventes_ic_en – Recent sales and ordering intentions
tableautab1_en – Global data
| Ave. (1) | Jan. 15 | Feb. 15 | March 15 | April 15 | |
|---|---|---|---|---|---|
| Business climate | 100 | 103 | 101 | 104 | 103 |
| General business outlook | –30 | –31 | –33 | –29 | –26 |
| Recent sales | –7 | –8 | –3 | –6 | –3 |
| Expected sales | –3 | –3 | –2 | 5 | –2 |
| Ordering intentions | –9 | –2 | –6 | –3 | –5 |
| Stocks | 11 | 10 | 9 | 11 | 11 |
| Past selling prices (2) | –6 | –18 | –12 | ||
| Expected selling prices | –3 | –9 | –10 | –8 | –7 |
| Cash position (2) | –15 | –17 | –19 | ||
| Workforce size: recent trend | 0 | –4 | –2 | –8 | –5 |
| Workforce size: future trend | –3 | –9 | –8 | –5 | –7 |
- (1) Average since 1991 (2004 for recent and expected sales and ordering intentions).
- (2) Bi-monthly question (odd-numbered months).
- Source: monthly survey in the retail trade and in the trade and repair of motor vehicles - INSEE
Persistent pessimism about employment
The balance concerning recent trend on workforce size has slightly increased, the future trend one has moderatly dropped. Each of both has remained under its mean level.
Retail trade
Unstressed past and expected activities
More non-specialised retailers than in March have declared a fall in their past sales. The corresponding balance has become slightly under its average. In specialised retail trade, activity has remained particularly grim.
In retail trade, forecasts have been uncertain: expected sales have decreased, the corresponding balance going under its long term average, but ordering intentions have been almost stable, the balance staying near its average.
Retailers have estimed that their stocks are somewhat lower. They have come back to their standard level.
Fewer business leaders than over the last month have anticipated price falls over the next few months.
Trade and repair of motor vehicles
Very optimistic activity
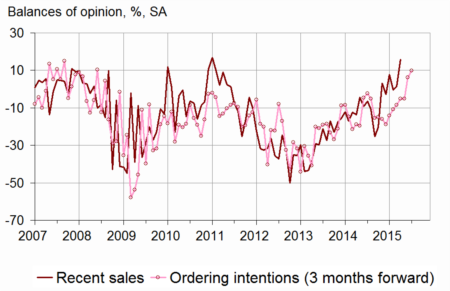
In the trade and repair of motor vehicles, more managers have indicated a new progress in their past sales. The corresponding balance has reached its highest level since the end of 2011. If the expected sales balance has declined, the ordering intentions one has sped up and each of both has remained significantly over its average.
graphiquegraph_ventes_ic_auto_en – Recent sales and ordering intentions in motor vehicles
The level of stocks is considered higher, over its standard level.
The expected prices balance is almost stable and near its mean level.
tableautab2_en – Detailed data
| Ave. (1) | Jan. 15 | Feb. 15 | March 15 | April 15 | |
|---|---|---|---|---|---|
| Retail trade - Global data | |||||
| Recent sales | –6 | –14 | –5 | –8 | –11 |
| Expected sales | –1 | –7 | 0 | 3 | –4 |
| Ordering intentions | –7 | –5 | –5 | –6 | –8 |
| Stocks | 10 | 7 | 6 | 12 | 10 |
| Past selling prices (2) | –8 | –26 | –19 | ||
| Expected selling prices | –5 | –14 | –13 | –14 | –12 |
| Cash position (2) | –13 | –18 | –18 | ||
| Workforce size: recent trend | 1 | –1 | 0 | –9 | –5 |
| Workforce size: future trend | –2 | –10 | –7 | –6 | –9 |
| Non-specialised retail trade | |||||
| Recent sales | –2 | –1 | 10 | 5 | 0 |
| Expected sales | 5 | –11 | 10 | 16 | 7 |
| Ordering intentions | 1 | –1 | 2 | 2 | 3 |
| Stocks | 7 | 0 | 6 | 13 | 11 |
| Past selling prices (2) | –8 | –25 | –25 | ||
| Expected selling prices | –5 | –8 | –11 | –13 | –11 |
| Cash position (2) | –7 | –11 | –10 | ||
| Specialised retail trade | |||||
| Recent sales | –11 | –29 | –21 | –25 | –24 |
| Expected sales | –8 | –17 | –16 | –15 | –16 |
| Ordering intentions | –17 | –24 | –15 | –18 | –18 |
| Stocks | 14 | 15 | 6 | 10 | 9 |
| Past selling prices (2) | –8 | –24 | –16 | ||
| Expected selling prices | –5 | –22 | –16 | –14 | –13 |
| Cash position (2) | –22 | –27 | –29 | ||
| Trade and repair of motor cars and motorcycles | |||||
| Recent sales | –11 | 8 | –1 | 2 | 16 |
| Expected sales | –9 | 2 | –6 | 11 | 5 |
| Ordering intentions | –13 | –5 | –5 | 6 | 10 |
| Stocks | 15 | 18 | 16 | 10 | 12 |
| Past selling prices (2) | 1 | 1 | 7 | ||
| Expected selling prices | 4 | –8 | –3 | 6 | 5 |
| Cash position (2) | –25 | –19 | –19 | ||
| Workforce size: recent trend | –10 | –15 | –10 | –7 | –5 |
| Workforce size: future trend | –8 | –7 | –6 | –2 | –1 |
- (1) Average since 1991 (2003 for trade and repair of motor vehicles and 2004 for recent and expected sales and ordering intentions).
- (2) Bi-monthly question (odd-numbered months).
- Source: monthly survey in the retail trade and in the trade and repair of motor vehicles - INSEE
Documentation
Methodology (pdf,129 Ko)
Pour en savoir plus
