


 23 June 2015
2015- n° 149In June 2015, the business climate in manufacturing has fallen back Monthly business survey (goods-producing industries) - June 2015
23 June 2015
2015- n° 149In June 2015, the business climate in manufacturing has fallen back Monthly business survey (goods-producing industries) - June 2015
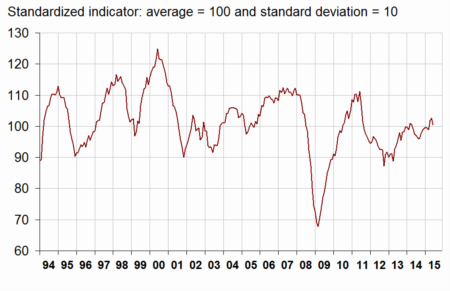
According to the business managers surveyed in June 2015, the business climate in industry has fallen back: the composite indicator which measures it has decreased by three points, after an increase of four points between March and May. It has returned to its long-term average (100).
Manufacturing industry
According to the business managers surveyed in June 2015, the business climate in industry has fallen back: the composite indicator which measures it has decreased by three points, after an increase of four points between March and May. It has returned to its long-term average (100).
graphiqueGraphang1 – Business climate in industry - Composite indicator
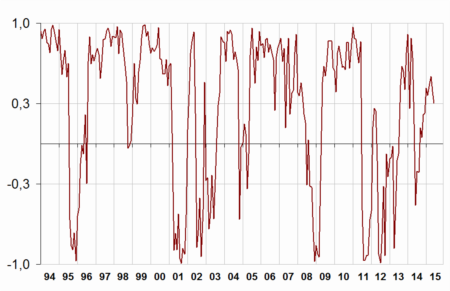
The turning-point indicator has decreased albeit remaining in the zone indicating a favourable economic outlook.
graphiqueGraphang2 – Turning-point indicator
After an increase by 25 points between March and May, the balance of opinion on past activity has dropped sharply in June (-9 points) but stands above its long-term average. The one on personal production expectations remains unchanged, slightly above its long-term average.
The balance of opinion on general production expectations of the sector is virtually stable above its long-term average.
In June, global and export order books have deteriorated a little and the corresponding balances stand below their long-term average.
Finally, a few more industrialists judge that stocks of finished products are lower than normal. The corresponding balance stays at a level below its average.
tableautableau1 – Industrialists' opinion on manufacturing industrial activity
| Manufacturing industry | Ave.* | March 15 | April 15 | May 15 | June 15 |
|---|---|---|---|---|---|
| Composite indicator | 100 | 99 | 102 | 103 | 100 |
| Past activity | 4 | –10 | 5 | 16 | 7 |
| Finished-goods inventory | 13 | 5 | 8 | 9 | 7 |
| Global order books | –19 | –20 | –18 | –19 | –22 |
| Export order books | –14 | –12 | –8 | –13 | –15 |
| Personal production expectations | 5 | 8 | 6 | 6 | 6 |
| General production expectations | –9 | 0 | 2 | –1 | –2 |
- * Long-term average since 1976.
- Source : Monthly business survey - Insee
Sector-based analysis
MAN. OF FOOD PRODUCTS AND BEVERAGES
In the manufacture of food products and beverages, the balance on past activity is virtually stable at a level significantly upper than its long-term average. The one on expected activity has declined but remains above its long-term mean. The balance on stocks of finished products has slightly increased and stays to a level lower than average. Global and export order books have improved and the corresponding balances are above their long-term average.
MACHINENERY AND EQUIPMENT GOODS
In the manufacture of machinery and equipment goods, industrialists judge that their past activity has been practically stable over the last three months, at a level lower than normal. The balance of opinion on production expectations has fallen and has become inferior to its long-term average. The balance of opinion on stocks of finished products has decreased to a level significantly close to its average level. Global and export order books are virtually stable and the corresponding balances of opinion are below their long-term average.
MAN. OF TRANSPORT EQUIPMENT
Man. of motor vehicles, trailers and semi trailers
In the manufacture of motor vehicles, trailers and semi trailers, the balances on past activity and the one on production prospects have plunged but remain significantly higher than their average. Global order books have expanded a little and export order books are virtually stable; the corresponding balances of opinion are upper than normal. The balance of stocks of finished goods has slightly risen but is still below its long-term average.
Man. of other transport equipment
In the manufacture of other transport equipment, the balance on past activity and the one on production prospects have fallen back to a level lower than normal. The balance of opinion on stocks of finished products, already significantly above its mean level, has increased slightly in June. However, global order books have continued to improve, the corresponding balance of opinion is clearly above its long-term average.
OTHER MANUFACTURING
In the manufacture of pharmaceutical products, the balance of business managers’ opinion on their past activity has taken off and has become significantly higher than its mean level. This balance of opinion is virtually stable in that of plastic products, it has fallen in that of basic metals and it has slumped in that of chemical products. The balance on expected activity is virtually stable or has improved in all sectors of “other manufacturing”, excepted in the manufacture of chemical products where it has plummeted and has returned to its long-term average. Global and export order books have deteriorated in general and the corresponding balances of opinion are under their mean level. Finally, the balance of opinion on finished-goods inventories has diminished and it is now below normal in all sectors, excepted in the manufacture of plastics products where it remains slightly above its long-term average.
tableautableau2 – Industrialists' opinion in a sector-based approach
| NA* : (A17) et [A 38 et A 64] | Aver.** | April 15 | May 15 | June 15 |
|---|---|---|---|---|
| (C1) Man. of foods products and beverages | ||||
| Past activity | 6 | 3 | 14 | 15 |
| Finished-goods inventory | 12 | 13 | 7 | 9 |
| Global order books | –18 | –11 | –16 | –12 |
| Export order books | –13 | –3 | –10 | –4 |
| Personal production expectations | 7 | 9 | 11 | 8 |
| (C3) Machinery and equipment goods | ||||
| Past activity | 4 | –1 | –2 | –3 |
| Finished-goods inventory | 17 | 22 | 24 | 18 |
| Global order books | –24 | –32 | –27 | –29 |
| Export order books | –21 | –22 | –26 | –28 |
| Personal production expectations | 2 | –1 | 4 | –4 |
| (C4) Man. of transport equipment | ||||
| Past activity | 8 | 39 | 31 | 15 |
| Finished-goods inventory | 14 | 12 | 21 | 24 |
| Global order books | –14 | 10 | 1 | 5 |
| Export order books | –12 | –9 | –15 | –9 |
| Personal production expectations | 8 | 35 | 34 | 19 |
| Man. of motor vehicules, trailers and semi-trailers [CL1] | ||||
| Past activity | 3 | 56 | 61 | 20 |
| Finished-goods inventory | 10 | 9 | –2 | 2 |
| Global order books | –20 | 10 | –16 | –12 |
| Export order books | –14 | 12 | –11 | –11 |
| Personal production expectations | 3 | 42 | 38 | 20 |
| Man. of other transport equipment [CL2] | ||||
| Past activity | 15 | 11 | 18 | 10 |
| Finished-goods inventory | 20 | 15 | 44 | 47 |
| Global order books | –5 | 11 | 19 | 24 |
| Export order books | –10 | –31 | –17 | –8 |
| Personal production expectations | 15 | 44 | 42 | 10 |
| (C5) Other manufacturing | ||||
| Past activity | 1 | 3 | 4 | 5 |
| Finished-goods inventory | 10 | 8 | 4 | –1 |
| Global order books | –20 | –25 | –20 | –26 |
| Export order books | –13 | –1 | –7 | –12 |
| Personal production expectations | 4 | –4 | –3 | 4 |
| Man. of chemicals and chemical products [CE] | ||||
| Past activity | 5 | 0 | 4 | –15 |
| Finished-goods inventory | 7 | 6 | –7 | –13 |
| Global order books | –13 | –17 | –6 | –20 |
| Export order books | –8 | 1 | 3 | –9 |
| Personal production expectations | 13 | –10 | 24 | 13 |
| Man. of basic pharmaceutical products [CF] | ||||
| Past activity | 16 | 10 | 13 | 57 |
| Finished-goods inventory | 9 | 7 | 7 | –37 |
| Global order books | 3 | –3 | 4 | 2 |
| Export order books | 10 | 1 | 5 | 4 |
| Personal production expectations | 14 | –40 | –37 | –28 |
| Man. of rubber and plastics products [CG] | ||||
| Past activity | –3 | –2 | 0 | 2 |
| Finished-goods inventory | 11 | 16 | 12 | 12 |
| Global order books | –25 | –42 | –44 | –41 |
| Export order books | –18 | –20 | –20 | –13 |
| Personal production expectations | –2 | –3 | –12 | –5 |
| Man. of basic metals and fabricated metal products [CH] | ||||
| Past activity | –1 | 11 | 14 | 6 |
| Finished-goods inventory | 7 | 14 | 6 | 1 |
| Global order books | –20 | –18 | –24 | –25 |
| Export order books | –16 | 10 | –17 | –21 |
| Personal production expectations | 1 | 1 | 0 | 1 |
- * NA: aggregated classification, based on the NAF rév.2..
- ** Long-term average since 1976.
- Source: INSEE - Monthly business survey
Documentation
Methodology (pdf,133 Ko)
Pour en savoir plus
Time series : Industry - Activity and demand
