


 19 June 2015
2015- n° 148In Q12015, the labour cost index - wages and salaries and the labour cost index -
total labour cost increased by 1.0% Labor cost index in industry, construction and services - 1st Quarter 2015
19 June 2015
2015- n° 148In Q12015, the labour cost index - wages and salaries and the labour cost index -
total labour cost increased by 1.0% Labor cost index in industry, construction and services - 1st Quarter 2015
In the first quarter of 2015, the labour cost index (LCI) - wages & salaries accelerated in the non-agricultural market sector excluding household services (+1.0% after +0.3%) in seasonally adjusted data. In year-on-year changes, the LCI - wages & salaries also accelerated (+1.8% after +1.2%). Worked hours slightly increased (+0.2% in year-on-year changes).

Nota bene: this “Informations rapides” on July 10th 2015 replaces one published and supersedes that June 19th. This new version underlines change the labour cost index reference year. Indeed, since the Q12015 publication, upon Eurostat request, the reference year for the labour cost indices is 2012: the average of the four 2012 quaterly indices is equal to 100.
Warning: The tax credit for encouraging competitiveness and jobs (CICE) has been included since Q12013 in the computation of the labour cost index as a subsidy received by the employer. The rate of the CICE increased from 4% to 6% on January 1st, 2014, and to 7.5% in overseas departments only on January 1st, 2015. In Q12015, in the non-agricultural market sector excluding household services, the year-on-year changes of the labour cost index (LCI) – total labour cost with or without CICE is 1.8%. The CICE has no impact on Q12015 quarterly variation nor on LCI – wages & salaries.
The labour cost index - wages & salaries increased by 1.0%
In the first quarter of 2015, the labour cost index (LCI) - wages & salaries accelerated in the non-agricultural market sector excluding household services (+1.0% after +0.3%) in seasonally adjusted data. In year-on-year changes, the LCI - wages & salaries also accelerated (+1.8% after +1.2%). Worked hours slightly increased (+0.2% in year-on-year changes).
graphiqueGraphSSangl – LCI - wages and salaries: year-on-year changes
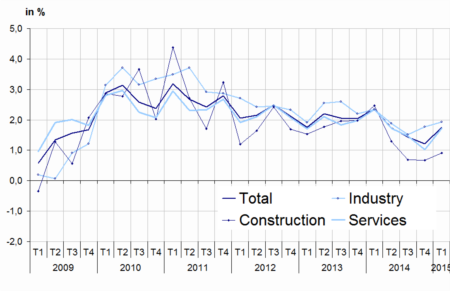
- Sources: Acoss, Dares, Insee
Wages increased by 0.6% in industrial activities
In Q12015, wages increased again in industrial activities (+0.6% after +0.7%). Wages rose in manufacturing at the same pace as in Q42014 (+0.7%). However, wages slightly fell back in electricity and gas (-0.2% after +0.2%). Year-on-year, wages in industrial activities slightly accelerated (+1.9% after +1.8%).
Wages accelerated in services
In services, wages accelerated sharply (+1.1%) compared to the previous quarter (+0.2%), particularly in information and communication, and administrative and support service activities, despite a drop in transportation and storage, and a significant slowdown in real estate activities. In year-on-year changes, wages also accelerated (+1.7% after +1.0%).
In construction, wages slightly sped up in Q12015 quarter-on-quarter (+0.6% after +0.5%) as well as year-on-year (+0.9% after +0.7%).
tableautableauSSangl – LCI - wages & salaries
| Quarterly variations (%) | Annual variations (%) | |||
|---|---|---|---|---|
| Q4-15 | Q1-15 | Q4-15 | Q1-15 | |
| Industry | 0.7 | 0.6 | 1.8 | 1.9 |
| Mining and quarrying | –0.1 | 1.7 | 0.3 | 0.9 |
| Manufacturing | 0.7 | 0.7 | 1.8 | 2.1 |
| Electricity, gas, steam and air conditioning supply | 0.2 | –0.2 | 1.4 | 0.7 |
| Water supply; sewerage, waste management and remediation activities | –0.3 | 0.2 | 0.8 | 0.8 |
| Services | 0.2 | 1.1 | 1.0 | 1.7 |
| Wholesale and retail trade; repair of motor vehicles and motorcycles | 0.4 | 0.5 | 1.4 | 1.5 |
| Transportation and storage | 0.3 | –0.2 | 1.1 | 0.8 |
| Accommodation and food service activities | 0.3 | 0.2 | 1.9 | 1.1 |
| Information and communication | 0.4 | 1.3 | 1.1 | 2.2 |
| Financial and insurance activities | –0.1 | 1.7 | 1.1 | 1.6 |
| Real estate activities | 1.6 | 0.4 | 2.2 | 2.2 |
| Professional, scientific and technical activities | –0.5 | 2.7 | 0.6 | 2.7 |
| Administrative and support service activities | 0.3 | 1.5 | –0.2 | 1.5 |
| Construction | 0.5 | 0.6 | 0.7 | 0.9 |
| TOTAL | 0.3 | 1.0 | 1.2 | 1.8 |
- Sources: ACOSS, DARES, INSEE
- Field: non-agricultural market sector excluding household services
Small upward revision of Q42014 LCI – total labour cost
The variation of wages and salaries during the fourth quarter of 2014 in the non-agricultural market sector excluding household services is revised by +0.1 point quarter-on-quarter and not revised year-on-year.
The labour cost index - total labour cost increased by 1.0%
In the first quarter of 2015, the labour cost index (LCI) - total labour cost in the non-agricultural market sector excluding household services accelerated (+1.0% in seasonnally adjusted data, after +0.3% in the fourth quarter of 2014).
Year-on-year, the LCI - total labour cost also accelerated (+1.8% after +0.4%). Without the tax credit for encouraging competitiveness and jobs (CICE), the LCI - total labour cost would have sped up more sligthly (+1.8% after +1.3% in year-on-year changes).
graphiqueGraphSCangl – LCI - total labor cost: year-on-year changes
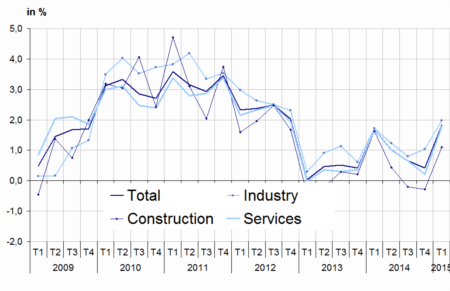
- Sources: Acoss, Dares, Insee
No revision of Q42014 LCI – total labour cost
The variation of labour cost index (LCI) – total labour cost in the fourth quarter of 2014 in the non-agricultural market sector excluding household services is not revised-neither quarter-on-quarter nor year-on-year.
tableautableauSCangl – LCI - total labor cost
| Quarterly variations (%) | Annual variations (%) | |||
|---|---|---|---|---|
| Q4-15 | Q1-15 | Q4-15 | Q1-15 | |
| Industry | 0.7 | 0.6 | 1.0 | 2.0 |
| Mining and quarrying | –0.1 | 1.6 | –0.5 | 0.8 |
| Manufacturing | 0.7 | 0.7 | 1.1 | 2.1 |
| Electricity. gas. steam and air conditioning supply | 0.2 | –0.2 | 1.0 | 0.7 |
| Water supply; sewerage. waste management and remediation activities | –0.2 | 0.0 | –0.1 | 0.7 |
| Services | 0.2 | 1.1 | 0.2 | 1.8 |
| Wholesale and retail trade; repair of motor vehicles and motorcycles | 0.4 | 0.5 | 0.5 | 1.7 |
| Transportation and storage | 0.3 | –0.4 | 0.0 | 0.6 |
| Accommodation and food service activities | 0.4 | 0.3 | 0.4 | 1.3 |
| Information and communication | 0.4 | 1.3 | 0.6 | 2.3 |
| Financial and insurance activities | –0.2 | 1.8 | 0.7 | 1.6 |
| Real estate activities | 1.7 | 0.3 | 1.5 | 2.3 |
| Professional. scientific and technical activities | –0.5 | 2.7 | 0.1 | 2.8 |
| Administrative and support service activities | 0.2 | 1.5 | –1.3 | 1.3 |
| Construction | 0.5 | 0.6 | –0.3 | 1.1 |
| TOTAL | 0.3 | 1.0 | 0.4 | 1.8 |
- Sources: ACOSS. DARES. INSEE
- Field: non-agricultural market sector excluding household services
tableau – LCI - total labor cost (without CICE)
| Quarterly variations (%) | Annual variations (%) | |||||||
|---|---|---|---|---|---|---|---|---|
| Q4-15 | Q1-15 | Q4-15 | Q1-15 | |||||
| Industry | 0.7 | 0.6 | 1.9 | 2.0 | ||||
| Mining and quarrying | –0.1 | 1.6 | 0.5 | 0.9 | ||||
| Manufacturing | 0.7 | 0.7 | 2.0 | 2.1 | ||||
| Electricity. gas. steam and air conditioning supply | 0.2 | –0.2 | 1.6 | 0.7 | ||||
| Water supply; sewerage. waste management and remediation activities | –0.2 | 0.0 | 0.9 | 0.7 | ||||
| Services | 0.2 | 1.1 | 1.1 | 1.8 | ||||
| Wholesale and retail trade; repair of motor vehicles and motorcycles | 0.4 | 0.5 | 1.6 | 1.7 | ||||
| Transportation and storage | 0.3 | –0.4 | 1.1 | 0.7 | ||||
| Accommodation and food service activities | 0.4 | 0.3 | 1.8 | 1.3 | ||||
| Information and communication | 0.4 | 1.3 | 1.2 | 2.3 | ||||
| Financial and insurance activities | –0.2 | 1.8 | 1.2 | 1.6 | ||||
| Real estate activities | 1.7 | 0.3 | 2.4 | 2.3 | ||||
| Professional. scientific and technical activities | –0.5 | 2.7 | 0.7 | 2.8 | ||||
| Administrative and support service activities | 0.2 | 1.5 | –0.1 | 1.4 | ||||
| Construction | 0.5 | 0.6 | 0.8 | 1.1 | ||||
| TOTAL | 0.3 | 1.0 | 1.3 | 1.8 | ||||
- Sources: ACOSS. DARES. INSEE
- Field: non-agricultural market sector excluding household services
Pour en savoir plus
